<p>Now that I have Bluetooth working with Reticulum on the T-Beam, I have the option of testing my Reticulum mesh using Bluetooth instead of Lora. Were I using LoRa, I would have several people walking the neighborhood in an expanding circle fashion so that each node can only reach one other node. This requires having people at large distances from one another.</p>
<a href="https://salemdata.net/johnpress/wp-content/uploads/2026/05/four_separate.svg"><img class="size-full wp-image-769" role="img" src="https://salemdata.net/johnpress/wp-content/uploads/2026/05/four_separate.svg" alt="map showing green circles" width="201" height="150" /></a> 4 LoRa Units – Out Of Range
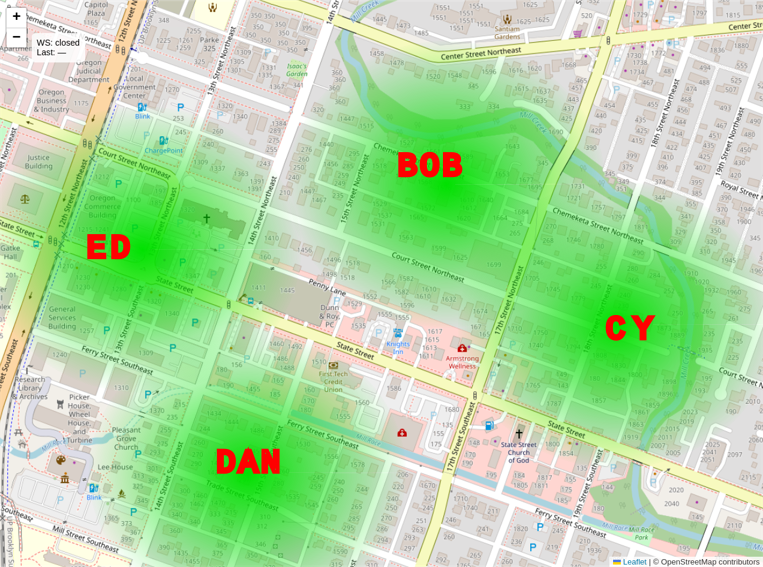
<p>Here is an illustration of four radio units: BOB, CY, DAN & ED. The green radial gradients represent their transmission reach. Each is far enough for any other that none of them can communicate with another; they are isolated.</p>
<p> </p>
<p> </p>
<p> </p>
<p> </p>
<a href="https://salemdata.net/johnpress/wp-content/uploads/2026/05/transmission_circle-1.svg"><img class="size-full wp-image-770" role="img" src="https://salemdata.net/johnpress/wp-content/uploads/2026/05/transmission_circle-1.svg" alt="map of 7 units with interconnecting arrows" width="279" height="215" /></a> Mesh Network
<p> </p>
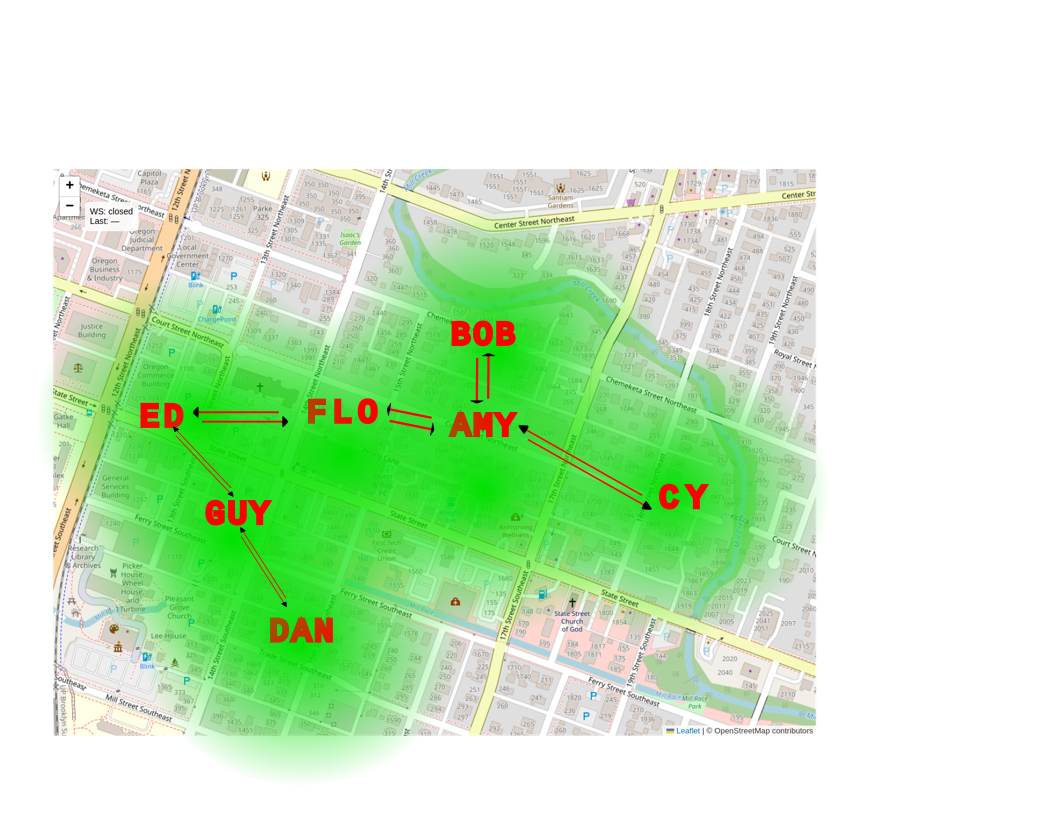
<p>Here is the isolated network above enhanced by three more units interposed so as to create a continuous “mesh” network.<br />
I have positioned 7 units named: AMY, BOB, CY, ED, FLO & GUY. Furthermore, I have created arrows indicating <em>the only transmission</em> ability between two given units. BOB and AMY can communicate directly. For BOB to reach CY, packets must route through AMY, so BOB->AMY and AMY->CY. In mesh terminology, this is called a “hop”. For BOB to reach ED, packets have to traverse 3 hops: BOB->AMY, AMY-> FLO and FLO->ED. For BOB to reach DAN, packets must traverse 5 hops. I want to stress test Reticulum and doing so over LoRa requires placing units on the fringe of their transmission capability. Bluetooth transmission capability is much less than LoRa, so if I use Bluetooth, I can narrow of the universe of units in the field to a much smaller area.</p>
<div></div>
<div></div>
<div>Instead of using LoRa as the transmission method, I can simulate the isolation by using Bluetooth. Bluetooth transmissions are measured by Received Signal Strength Indicator (“RSSI”). A low RSSI, e.g. -20 is a stronger value than -60. So i wanted to get a feel for what distances might be needed to create a weak RSSI between two unit so I could create a mesh purposefully by placing two units so far apart, they cannot see their signals, but if I place a third unit in between, the middle unit can transport each end unit’s package to the other. Hence, I wanted to test signal signal strength by having two units remain stationary and then I would hand carry two more units away from the stationary units to a point where I believe they two sets are out of range and then return.</div>
<div>Below is a graph of such an experiment where at the beginning, all four units are close together. Units BOB & CY remain stationary and constitute the “base” and I carry units ED & FLO away from the base about 120 feet and then return. As I move, all the units are sending Bluetooth announcements and likewise each unit is recording what has been received along with the RSSI.</div>
<div></div>
<div>The graph below shows time on the X-axis. At the commencement of the test the two carried units, ED & FLO, have strong signals between them and the stationary units. Then as I walk away, the signals weaken until there is no longer a received signal.. As I retrace my steps and return to the base, the RSSI values become stronger, moving from roughly -90 dBm back toward -50 dBm.</div>
<div></div>
<div class="reticulum-plotly-wide"><iframe title="Bluetooth Signal Test" src="https://salemdata.net/dev/reticulum/ble/exercise26_ble_field_test_20260527_1651.html"><br />
</iframe></div>
<div>With this information, I can determine which RSSI value I want to use as a line of demarcation in my T-Beam code. I’ll probably use: -65 as that appears to be a good point. Any signal stronger than -65 means a link can be established. Signals weaker than -65 will be ignored.</div>
<div></div>
<div>I used Codex to create the binary images on the T-Beams that broadcast and record broadcasts on their SD cards along with high precision times, all disciplined (meaning the units clocks are set as close as possible to “real time”) to my stratum 1 time server, so precision and variance among the units is less than 1/1,000th of a second. ChatGPT wrote the schema for the SQLite database, the Perl script parsing the T-Beam logs and storing data in the tables, and the web page displaying the Plotly graph and the Perl script feeding the data to the HTML page. The T-Beams are logging 19 fields, so juggling those among logs, database, and plots is really good task for AI.</div>
<div></div>
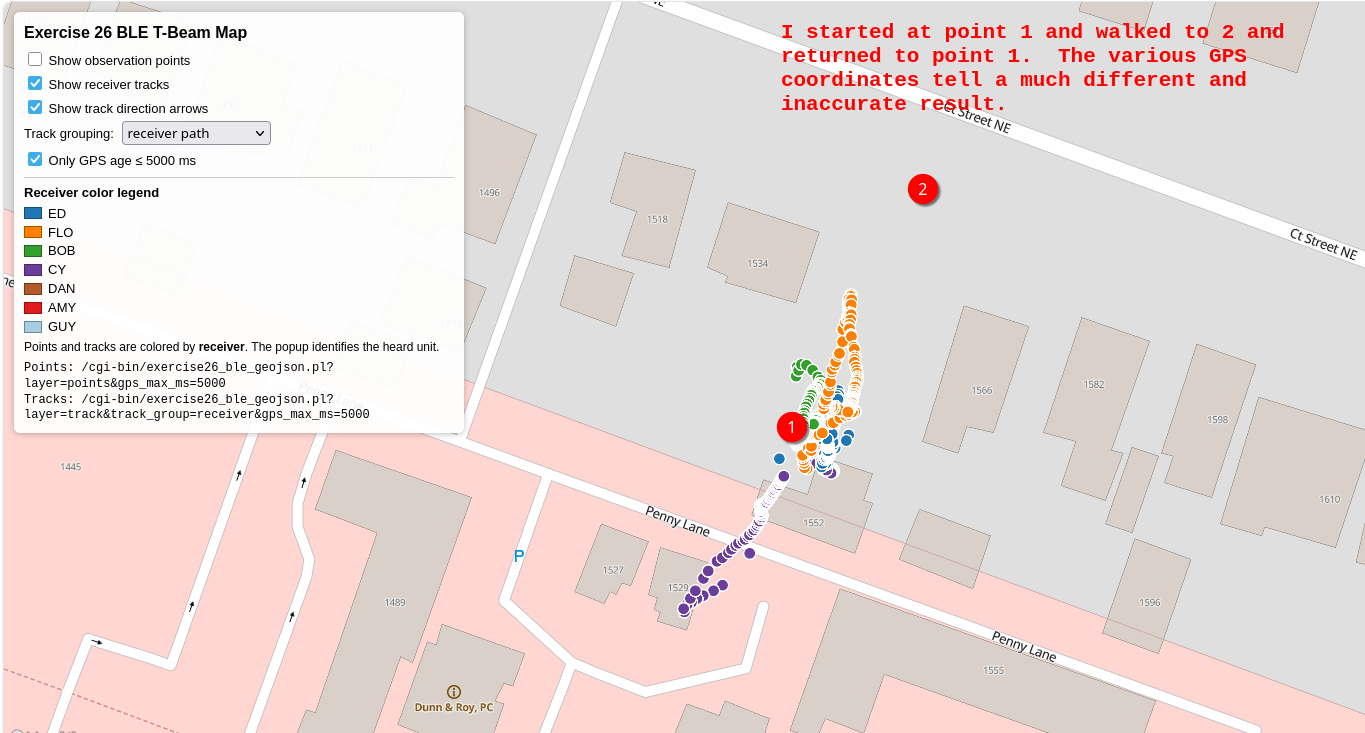
<div>What failed miserably here, however, were the GPS coordinates. Here’s a screenshot of a map that shows how woefully the GPS coordinates collected are in relation to reality. It is very clear to me that GPS coordinates on the T-Beam when collected in an urban environment are subject to 100′ or more variances. So the RSSI strength test was a success, I just did not get the hoped-for GPS precision.</div>
<div></div>
<div>
<img class="size-full wp-image-772" src="https://salemdata.net/johnpress/wp-content/uploads/2026/05/20260527_150930_Wed.png" alt="Map showing collected T-Beam points" width="1365" height="733" /> Collected GPS points
</div>
Now that I have Bluetooth working with Reticulum on the T-Beam, I have the option of testing my Reticulum mesh using Bluetooth instead of Lora. Were I using LoRa, I would have several people walking the neighborhood in an expanding circle fashion so that each node can only reach one other node. This requires having people at large distances from one another.
4 LoRa Units – Out Of Range
Here is an illustration of four radio units: BOB, CY, DAN & ED. The green radial gradients represent their transmission reach. Each is far enough for any other that none of them can communicate with another; they are isolated.
Mesh Network
Here is the isolated network above enhanced by three more units interposed so as to create a continuous “mesh” network.
I have positioned 7 units named: AMY, BOB, CY, ED, FLO & GUY. Furthermore, I have created arrows indicating the only transmission ability between two given units. BOB and AMY can communicate directly. For BOB to reach CY, packets must route through AMY, so BOB->AMY and AMY->CY. In mesh terminology, this is called a “hop”. For BOB to reach ED, packets have to traverse 3 hops: BOB->AMY, AMY-> FLO and FLO->ED. For BOB to reach DAN, packets must traverse 5 hops. I want to stress test Reticulum and doing so over LoRa requires placing units on the fringe of their transmission capability. Bluetooth transmission capability is much less than LoRa, so if I use Bluetooth, I can narrow of the universe of units in the field to a much smaller area.
Instead of using LoRa as the transmission method, I can simulate the isolation by using Bluetooth. Bluetooth transmissions are measured by Received Signal Strength Indicator (“RSSI”). A low RSSI, e.g. -20 is a stronger value than -60. So i wanted to get a feel for what distances might be needed to create a weak RSSI between two unit so I could create a mesh purposefully by placing two units so far apart, they cannot see their signals, but if I place a third unit in between, the middle unit can transport each end unit’s package to the other. Hence, I wanted to test signal signal strength by having two units remain stationary and then I would hand carry two more units away from the stationary units to a point where I believe they two sets are out of range and then return.
Below is a graph of such an experiment where at the beginning, all four units are close together. Units BOB & CY remain stationary and constitute the “base” and I carry units ED & FLO away from the base about 120 feet and then return. As I move, all the units are sending Bluetooth announcements and likewise each unit is recording what has been received along with the RSSI.
The graph below shows time on the X-axis. At the commencement of the test the two carried units, ED & FLO, have strong signals between them and the stationary units. Then as I walk away, the signals weaken until there is no longer a received signal.. As I retrace my steps and return to the base, the RSSI values become stronger, moving from roughly -90 dBm back toward -50 dBm.
With this information, I can determine which RSSI value I want to use as a line of demarcation in my T-Beam code. I’ll probably use: -65 as that appears to be a good point. Any signal stronger than -65 means a link can be established. Signals weaker than -65 will be ignored.
I used Codex to create the binary images on the T-Beams that broadcast and record broadcasts on their SD cards along with high precision times, all disciplined (meaning the units clocks are set as close as possible to “real time”) to my stratum 1 time server, so precision and variance among the units is less than 1/1,000th of a second. ChatGPT wrote the schema for the SQLite database, the Perl script parsing the T-Beam logs and storing data in the tables, and the web page displaying the Plotly graph and the Perl script feeding the data to the HTML page. The T-Beams are logging 19 fields, so juggling those among logs, database, and plots is really good task for AI.
What failed miserably here, however, were the GPS coordinates. Here’s a screenshot of a map that shows how woefully the GPS coordinates collected are in relation to reality. It is very clear to me that GPS coordinates on the T-Beam when collected in an urban environment are subject to 100′ or more variances. So the RSSI strength test was a success, I just did not get the hoped-for GPS precision.
Leave a Reply