I have been working and experimenting for several weeks with geophones, transducers, and spectral analysis software in furtherance of my Hyperscale Data Center Sound Monitor project. Freight trains are known to emit low-frequency and infrasonic energy, so I have made it my business to become a temporary train tracker.
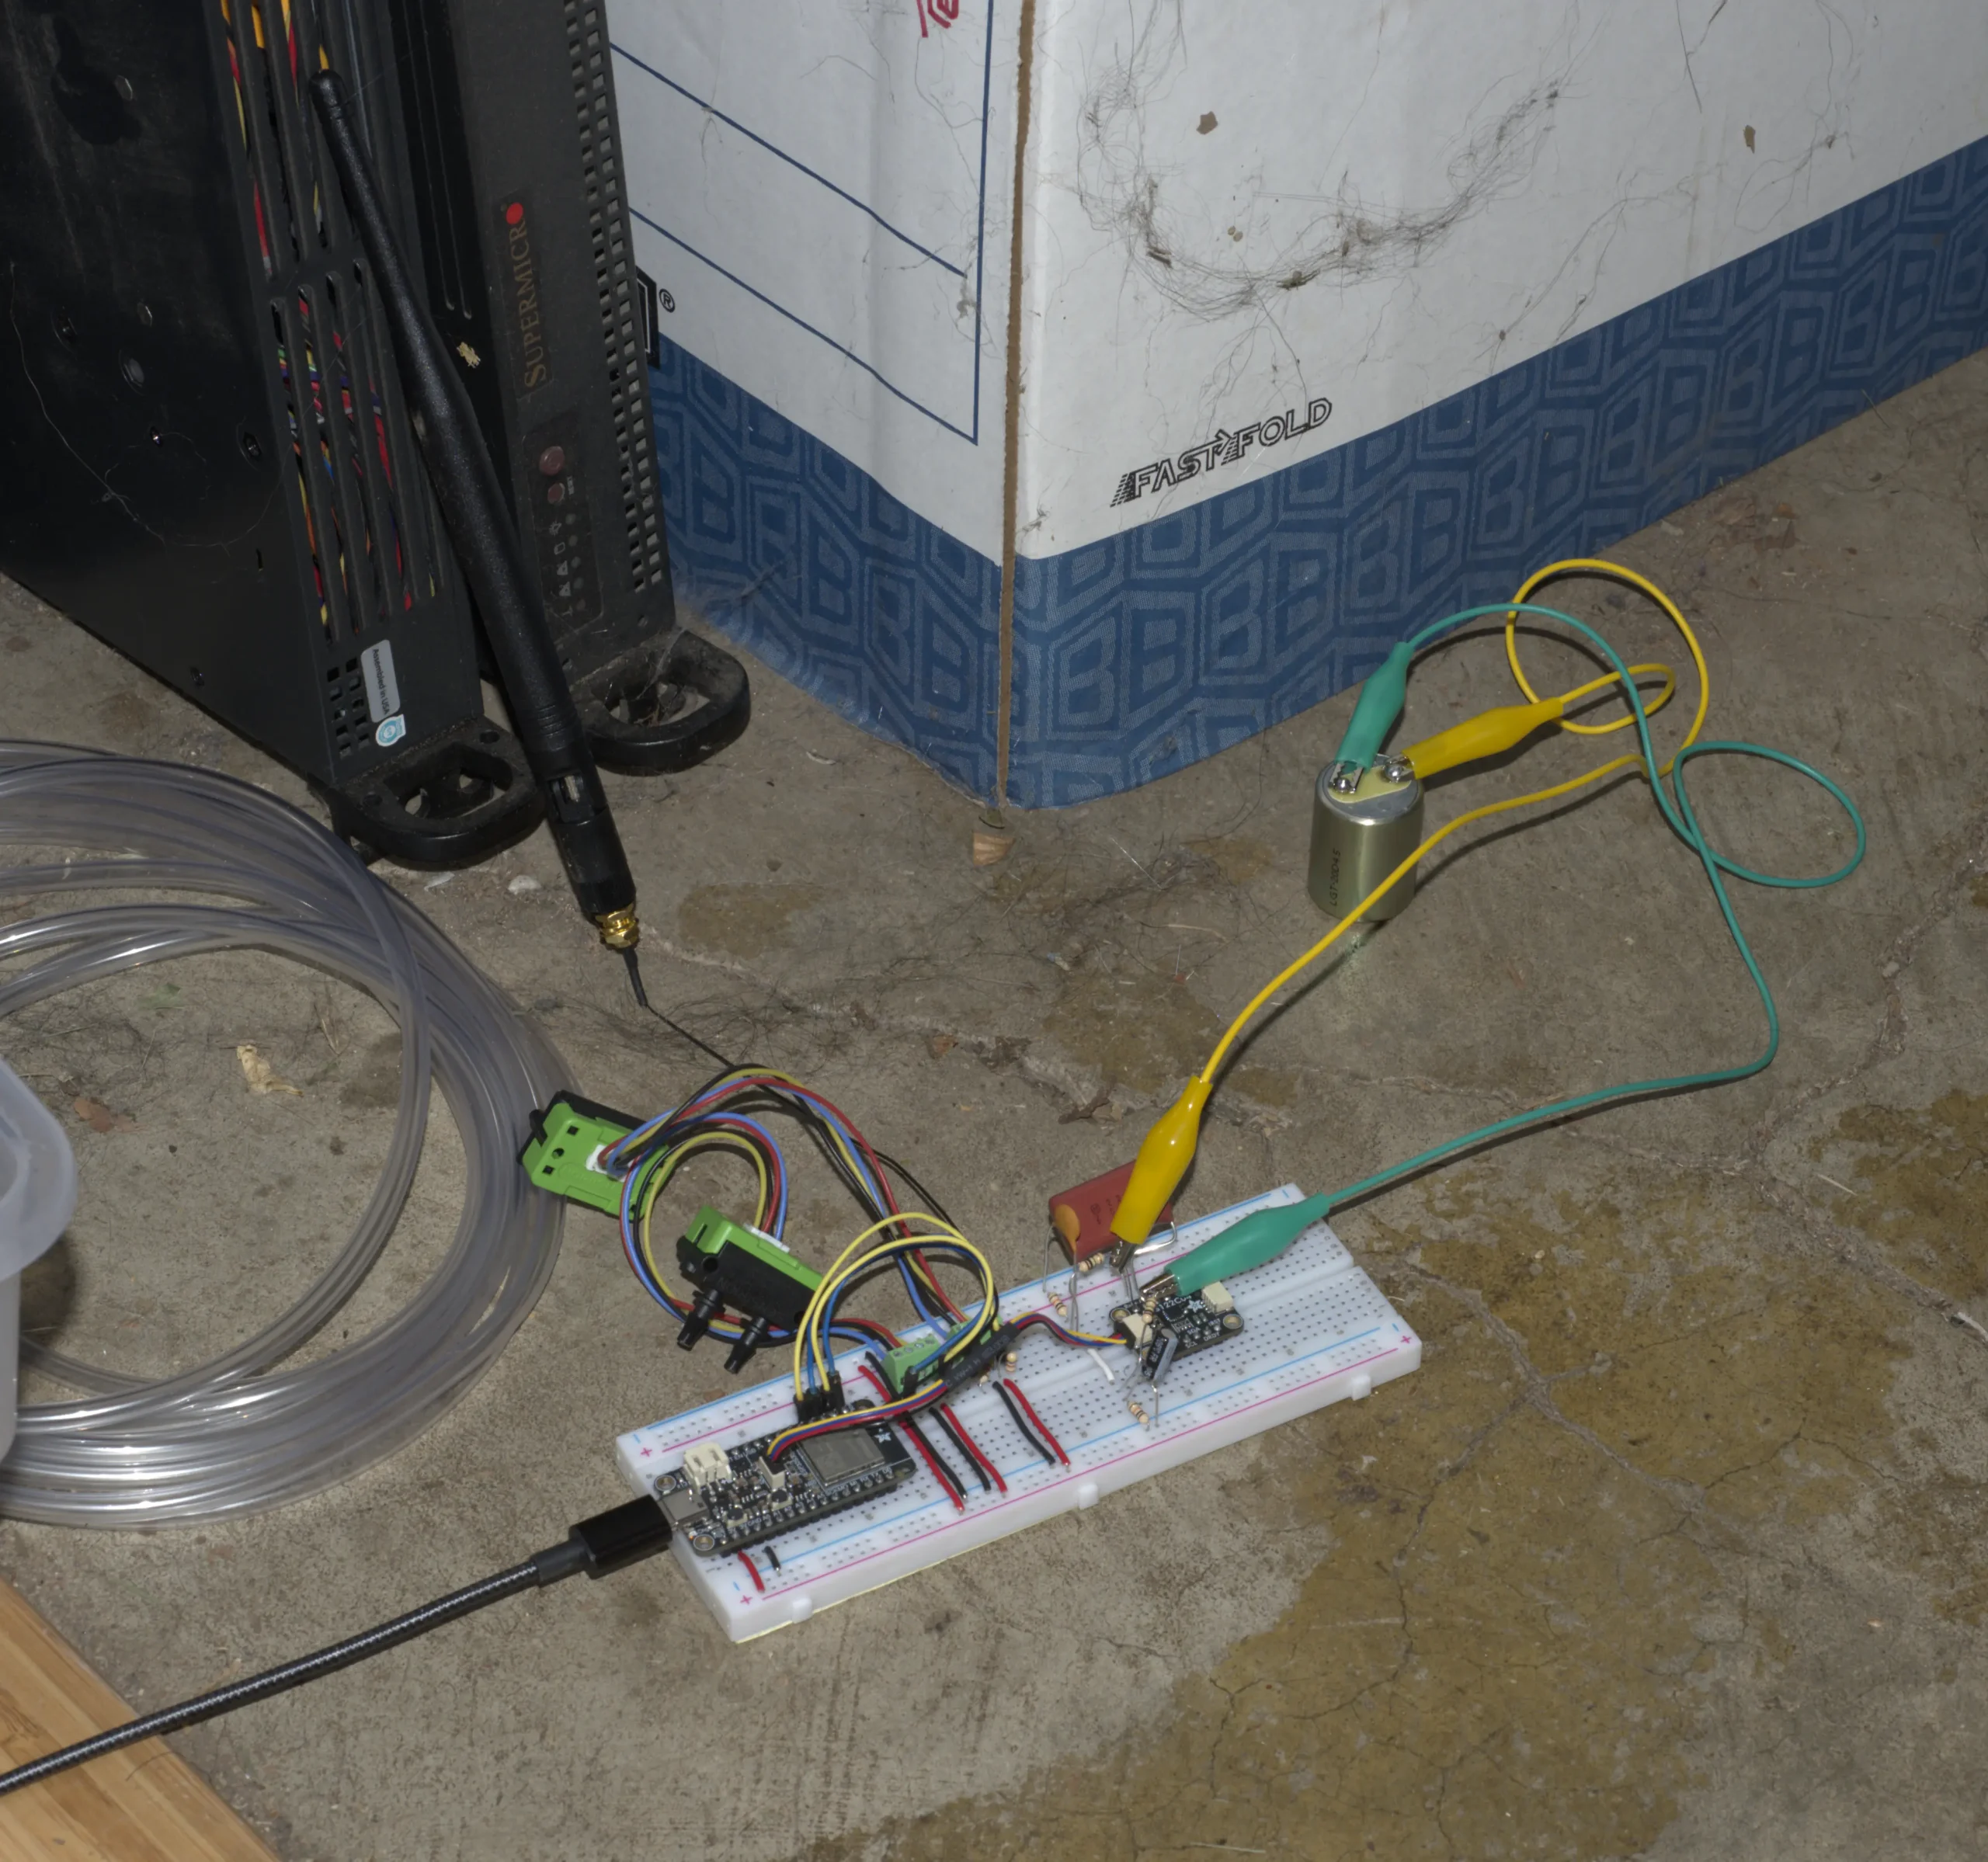
I’m currently collecting 330 samples/second from my geophone (with the yellow & green alligator clips), 100 samples/second from two transducers, and audio recordings outside. I’ve been taking videos of passing trains just down the street at the Court Street train crossing. I’ve been calculating the elevation profile of the train track to understand where an engine may be coasting or exerting itself given a known direction. I’ve been considering camping out overnight in my truck at train crossing. All of this in an effort to determine whether my geophone is sensing train-generated ground motion below 20 Hz. It has been a very heavy burden to worry about all this stuff.
Whenever I hear a train horn, or the rumble of a train (and sometimes the clanging of the crossing guard bells), I send myself an email to fix the date and time. Yes, when I am awakened at 3:30 in the morning, I send myself an email and even go out on our front porch to audibly confirm there is a freight train crossing Court Street. A couple of times, I even went out into the center of Court Street … barefoot, so I could see the crossing guard lights and dark shadowing freight cars lumbering along — and without a bathrobe — I’m such risk taker.
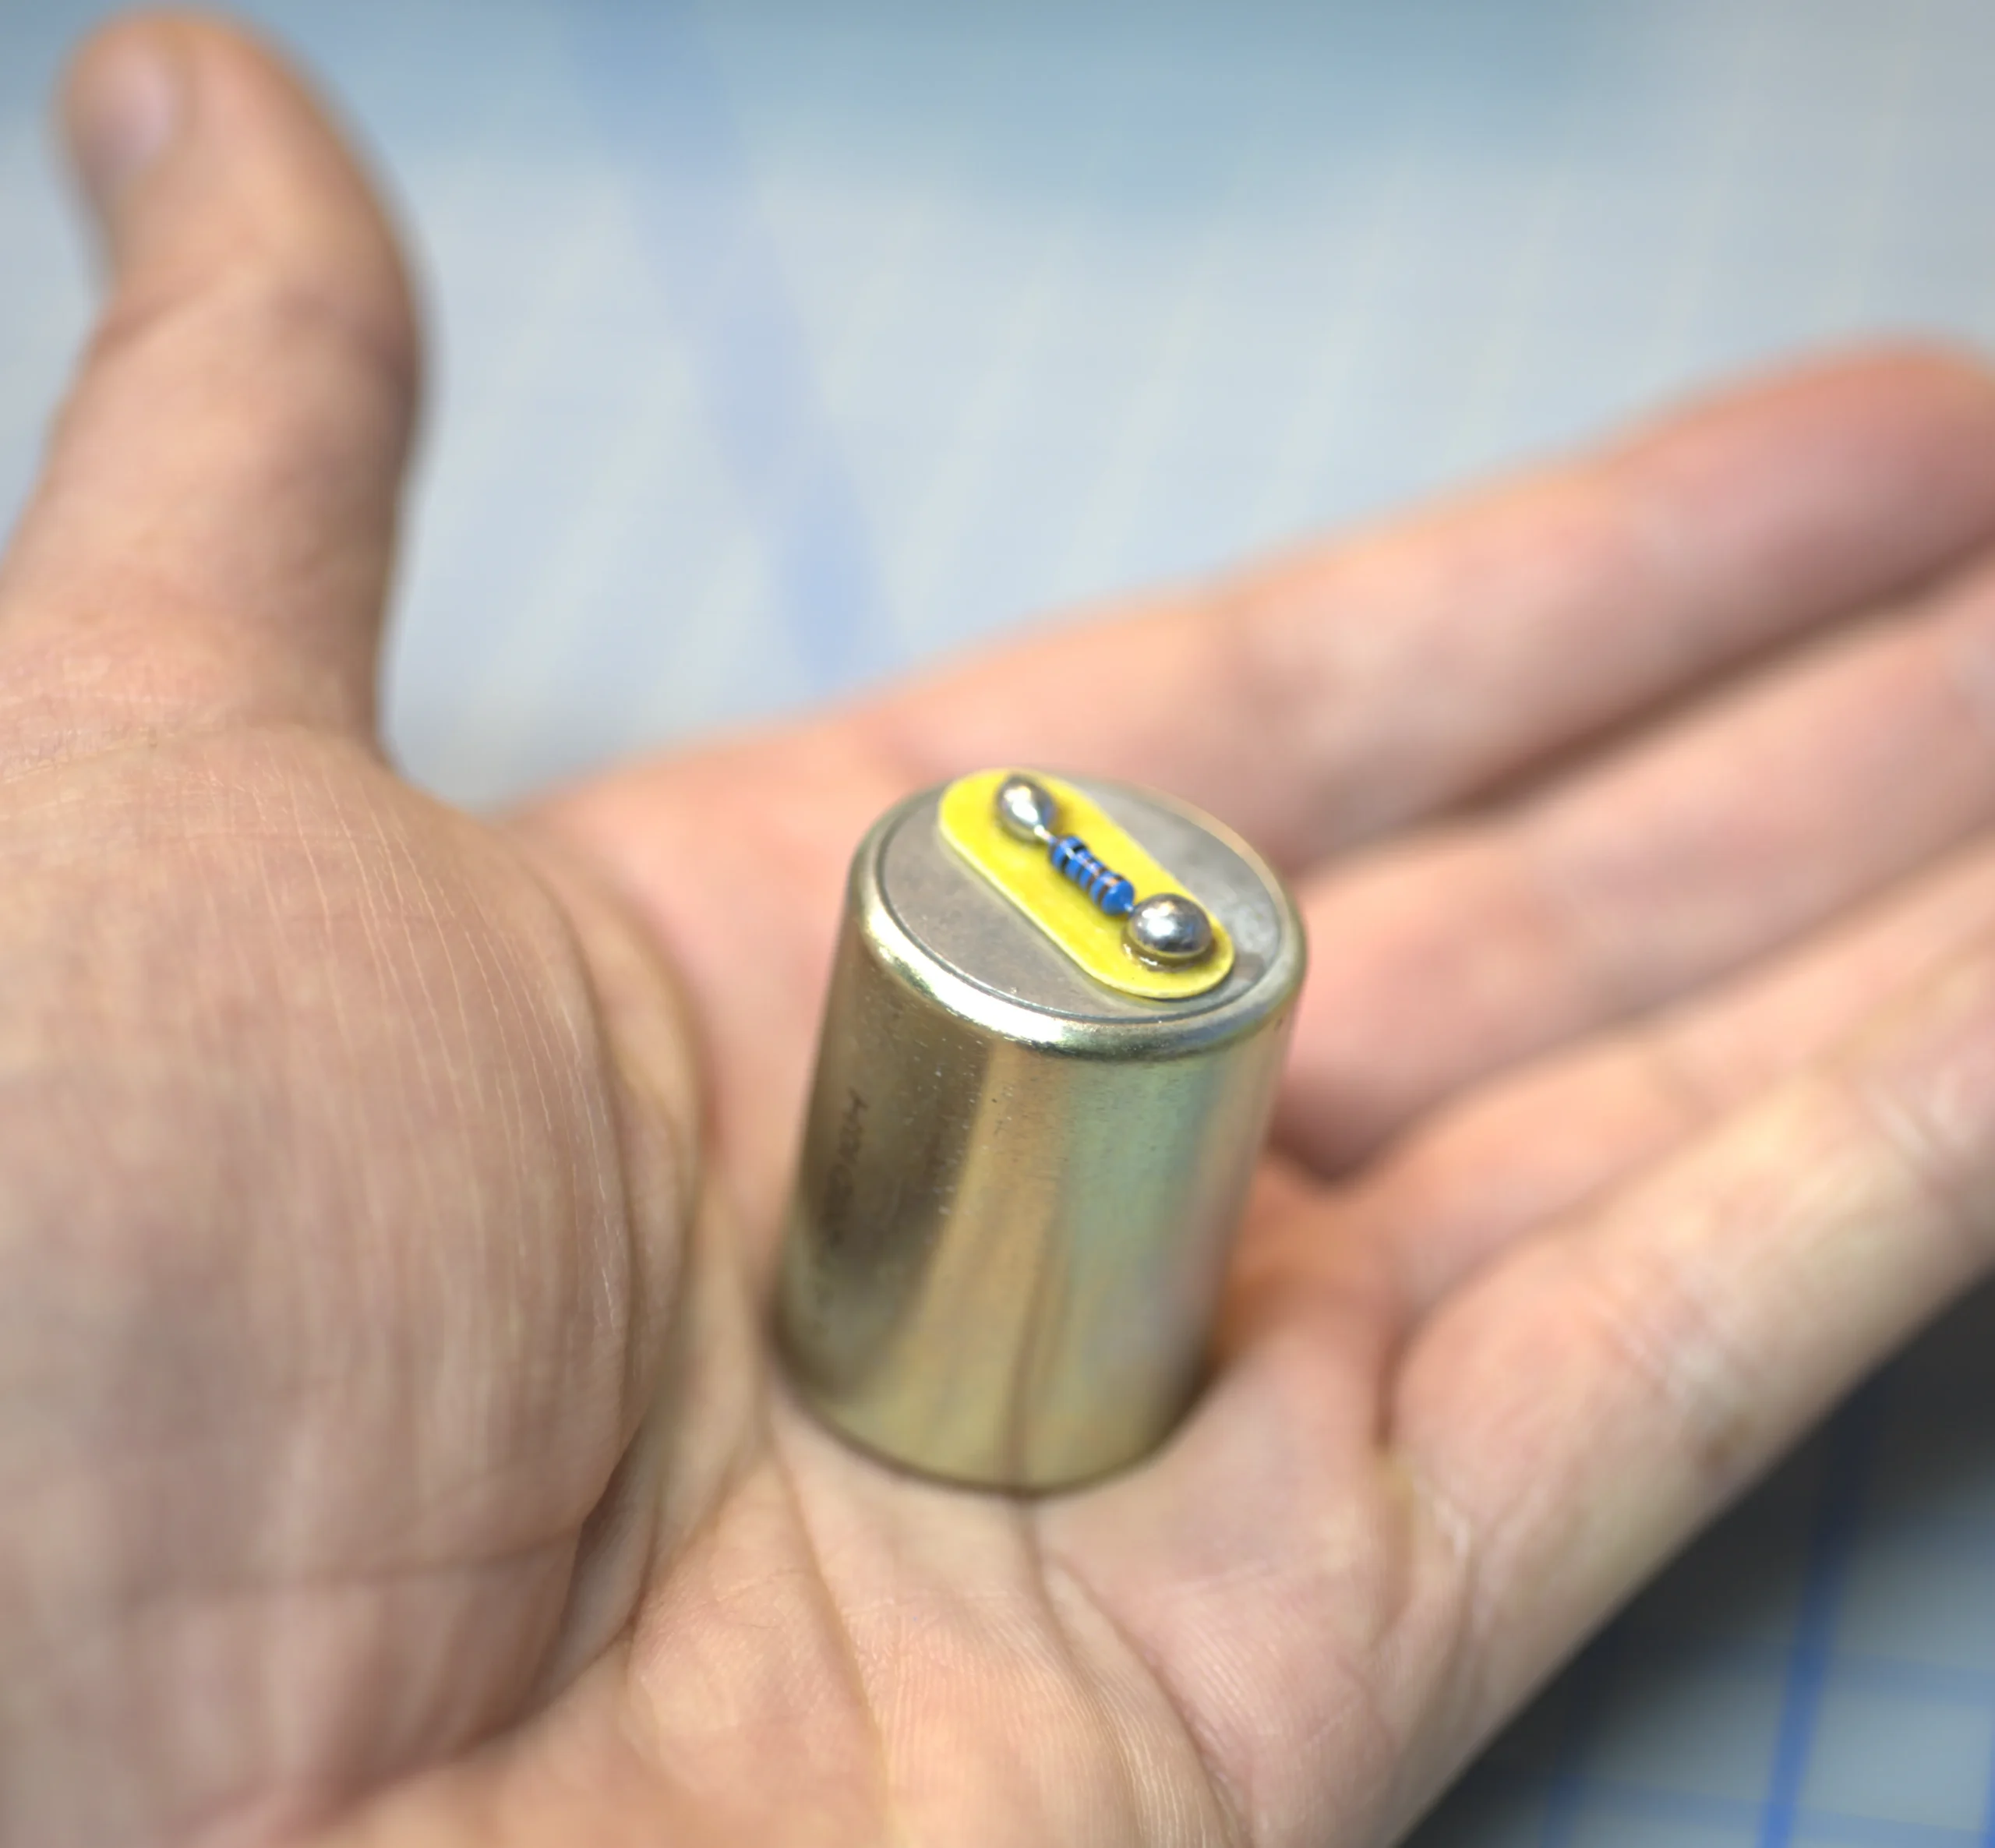
A geophone in hand.
This evening, I had a break-through.
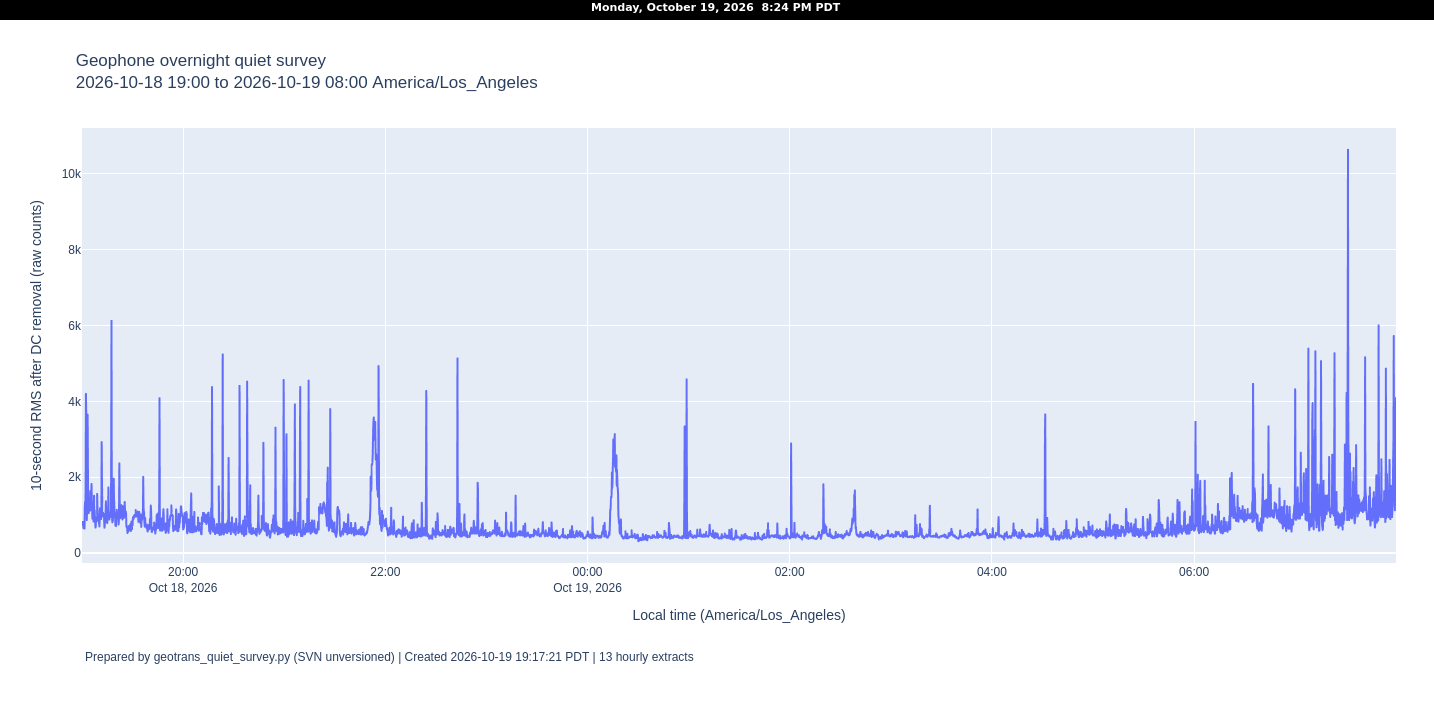
I decided we needed a base line: a period when no train activity occurs. Then, when a freight train crosses Court Street and my geophone registers activity, I can say that this sudden increase of activity is a result of the train. More importantly, that activity is measured at various low frequencies below 20 Hz and thus prove my geophone is doing its job. So we decided to survey a night time’s worth of recordings, about 15 million data points. I arbitrarily chose Sunday night through Monday morning (October 18-19th) and found some “promising” periods of no activity. Here’s the plot (click here to see the interactive plot where you can zoom and pan about) of night from 7:00 PM Sunday night to 8:00 AM Monday morning.
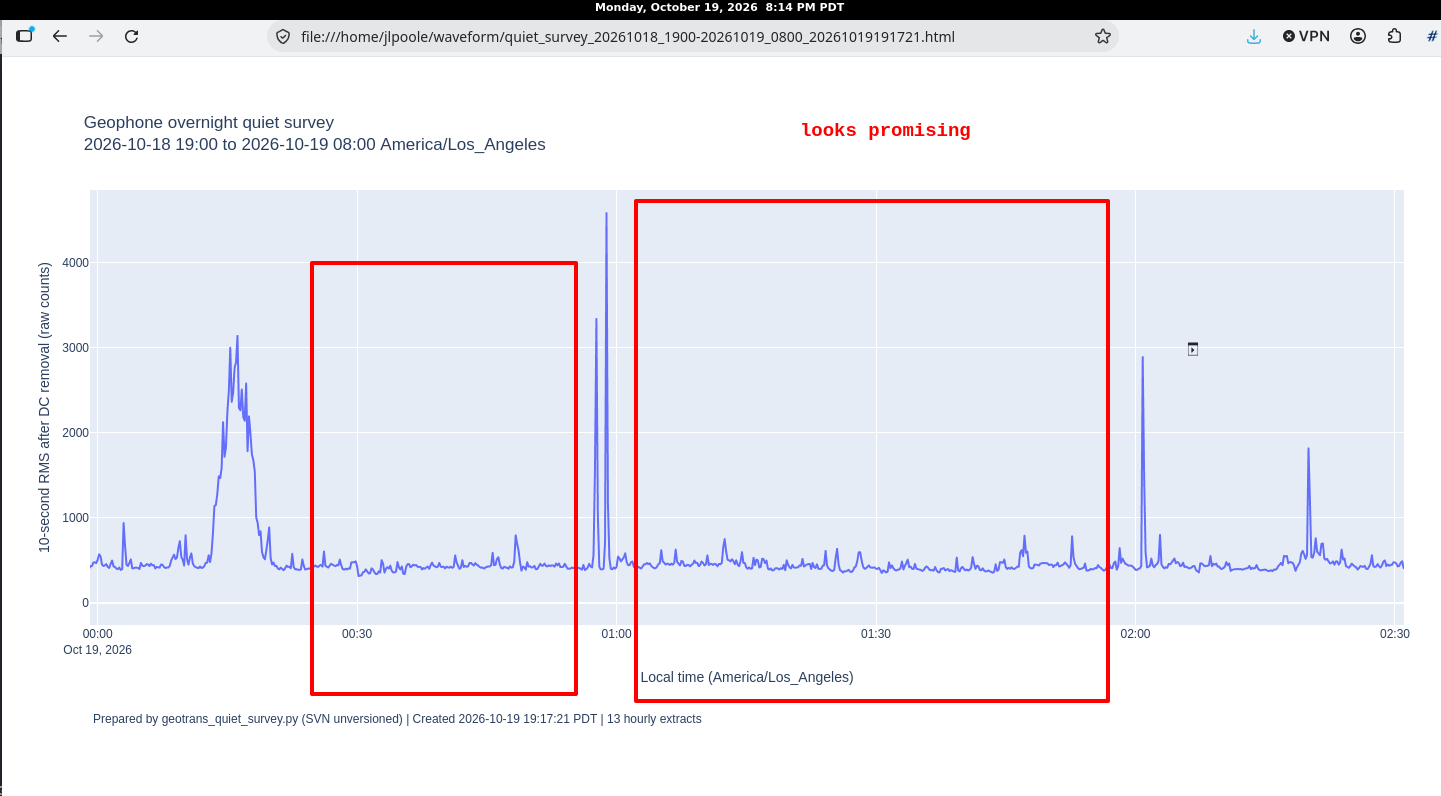
This survey looks pretty good and I selected two candidate quiet periods:
Then I thought, let’s see a survey where I know there has been a freight train in the night and let’s see how it appears. Remember, this is just the geophone (seismic) data. So my email shows I notified myself at 3:34 AM Saturday morning, and went out on our front porch and confirmed it was a freight train. So we performed a survey from 7:00 PM Friday night to 8:00 AM Saturday morning. (See here for the interactive plot.) Looks busy, huh?
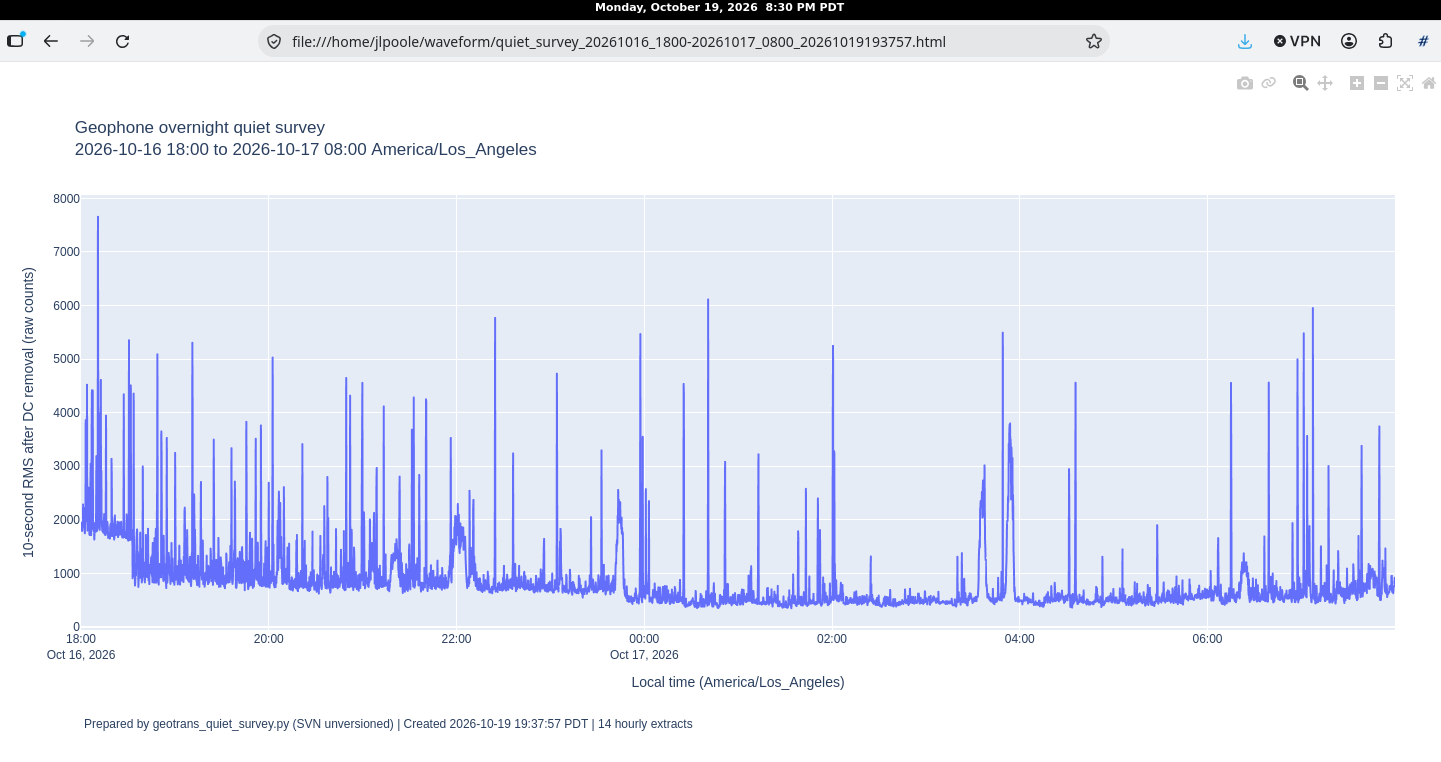
Well, see the spike before 4:00 AM? Here’s a screenshot zooming in.
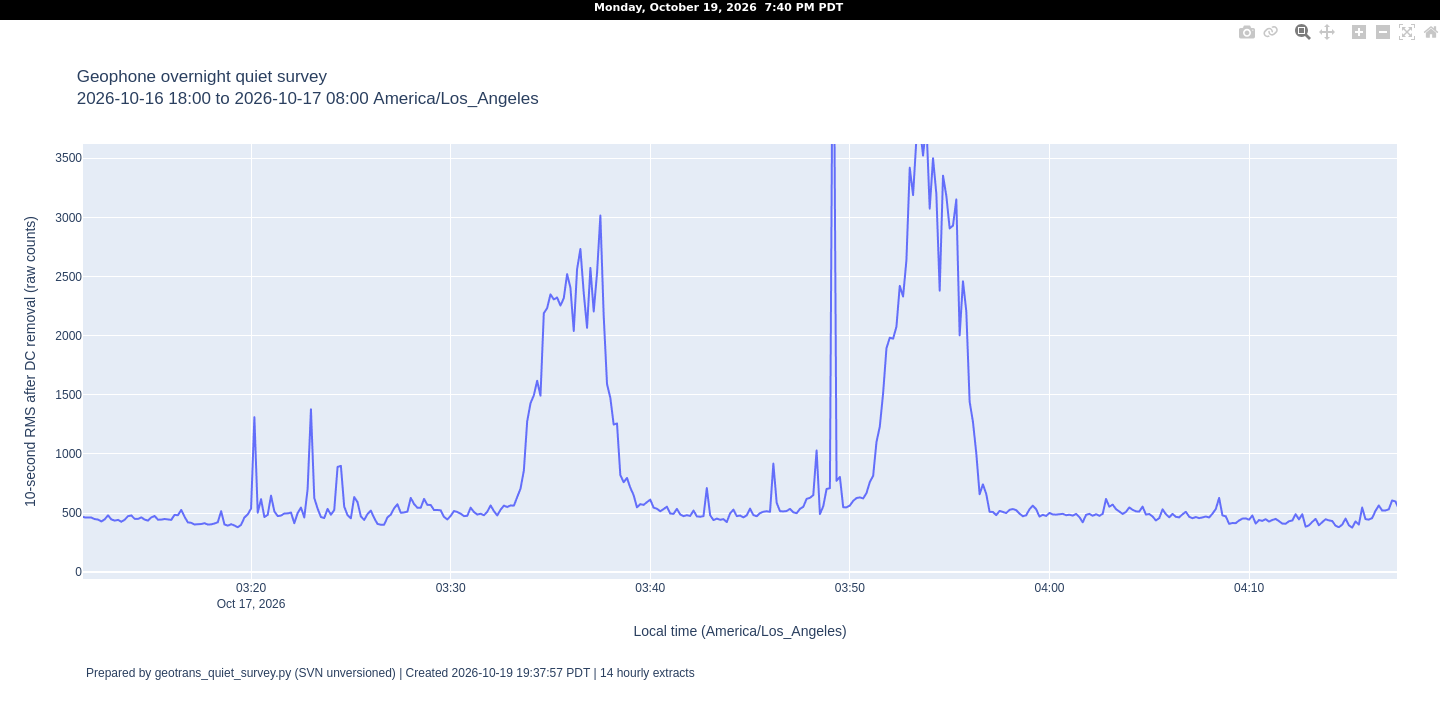
And here is 3:34 AM when I sent my email after the front porch confirmation.
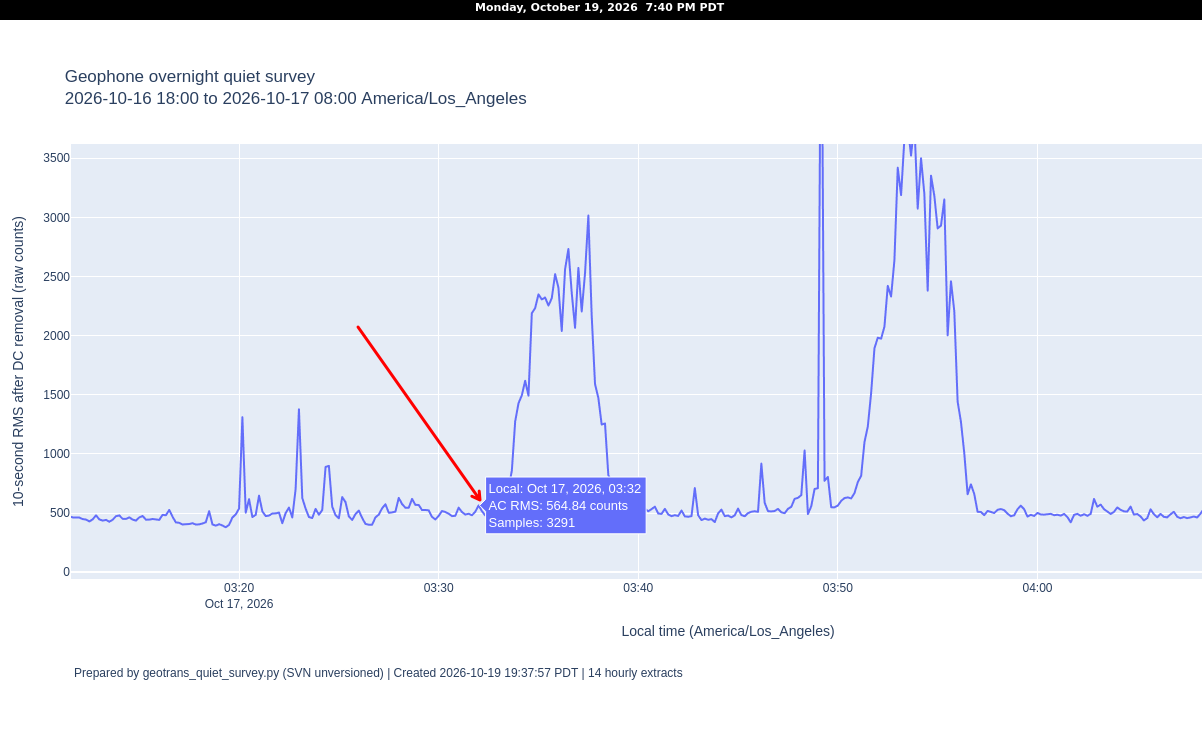
Boom! The big spike following the red arrow is the freight train. What this proves is that the reading off my geophone on our basement floor did indeed capture activity from the confirmed freight train.
Next: perform a spectral analysis to see what frequencies were present in the train-associated ground motion.
Leave a Reply