<p class="wp-block-paragraph">Growing orchids in Salem, OR, is not the same as growing in Pasadena, CA, where I started growing orchids in the 1960s. I had not given much thought about the difference in sunlight and now see that I should have. I specified my Salem greenhouse to have a 50% tinted polycarbonate roof thinking I could avoid shade cloth such as I used in Pasadena, but it turns out the tinted roofing is depriving my plants, especially citrus, of the much needed sunlight during the winter. I’m replacing the tinted roof panels with clear which will change the light transmission from 50% to 80%. I’ll then use a light shade cloth during the more intense summer months.</p>
<p class="wp-block-paragraph">I therefore embarked on a study to compare sunlight both with the three places I have lived: Pasadena, CA, Napa, CA, and presently Salem, OR. I also decided I wanted to see how those locations compared to three orchid merchants located in Hawaii, Florida, and Illinois. Therefore, a sunlight radiance study is in order.</p>
<p class="wp-block-paragraph"> </p>
<figure class="wp-block-image size-full wp-duotone-unset-2"><img class="wp-image-313" src="https://salemdata.net/johnpress/wp-content/uploads/2025/10/20251012_152217_Sun.jpg" alt="" />
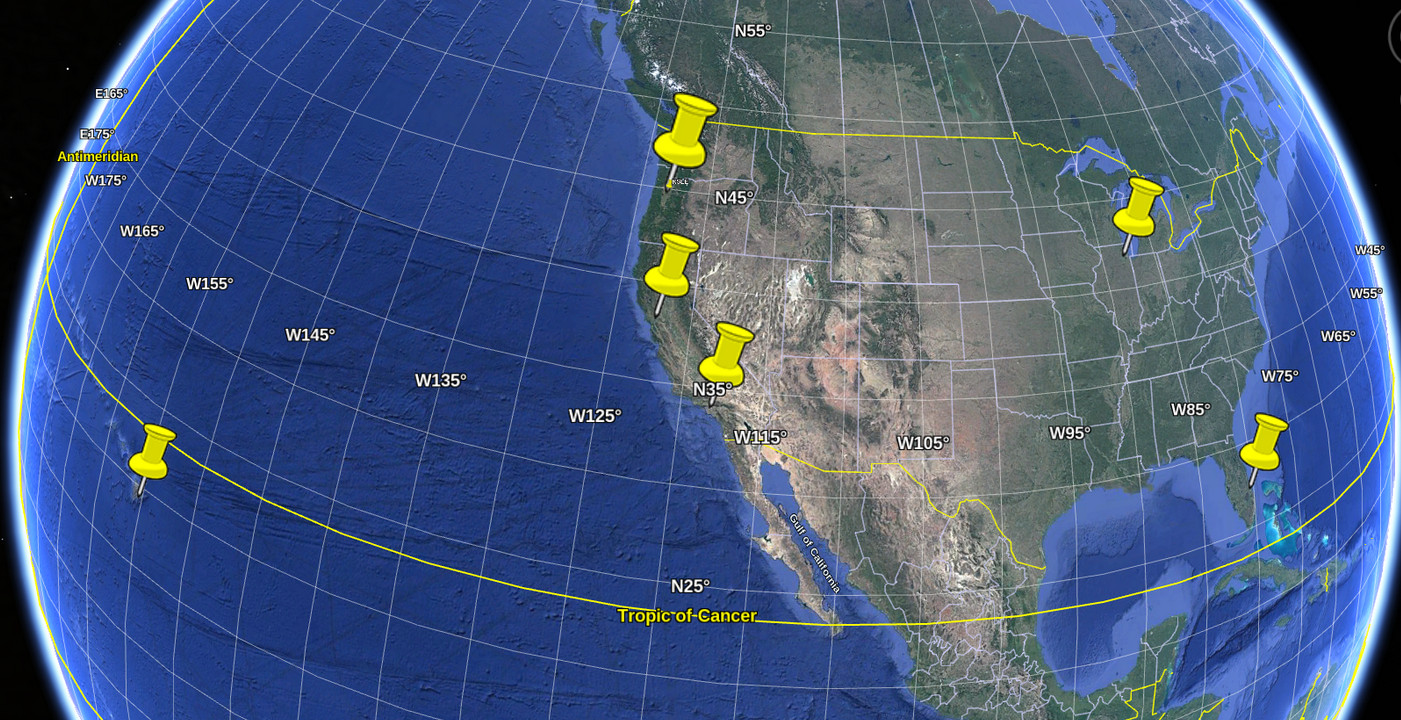
<figcaption class="wp-element-caption">Six Orchid/Citrus Locations Of Interest</figcaption>
</figure>
<p class="wp-block-paragraph">The six locations of interest are:</p>
<figure class="wp-block-table">
<table class="has-fixed-layout">
<tbody>
<tr>
<td><strong>Location</strong></td>
<td><strong>Description</strong></td>
<td><strong>Google Maps Screenshot</strong> <strong>Showing Coordinates</strong></td>
</tr>
<tr>
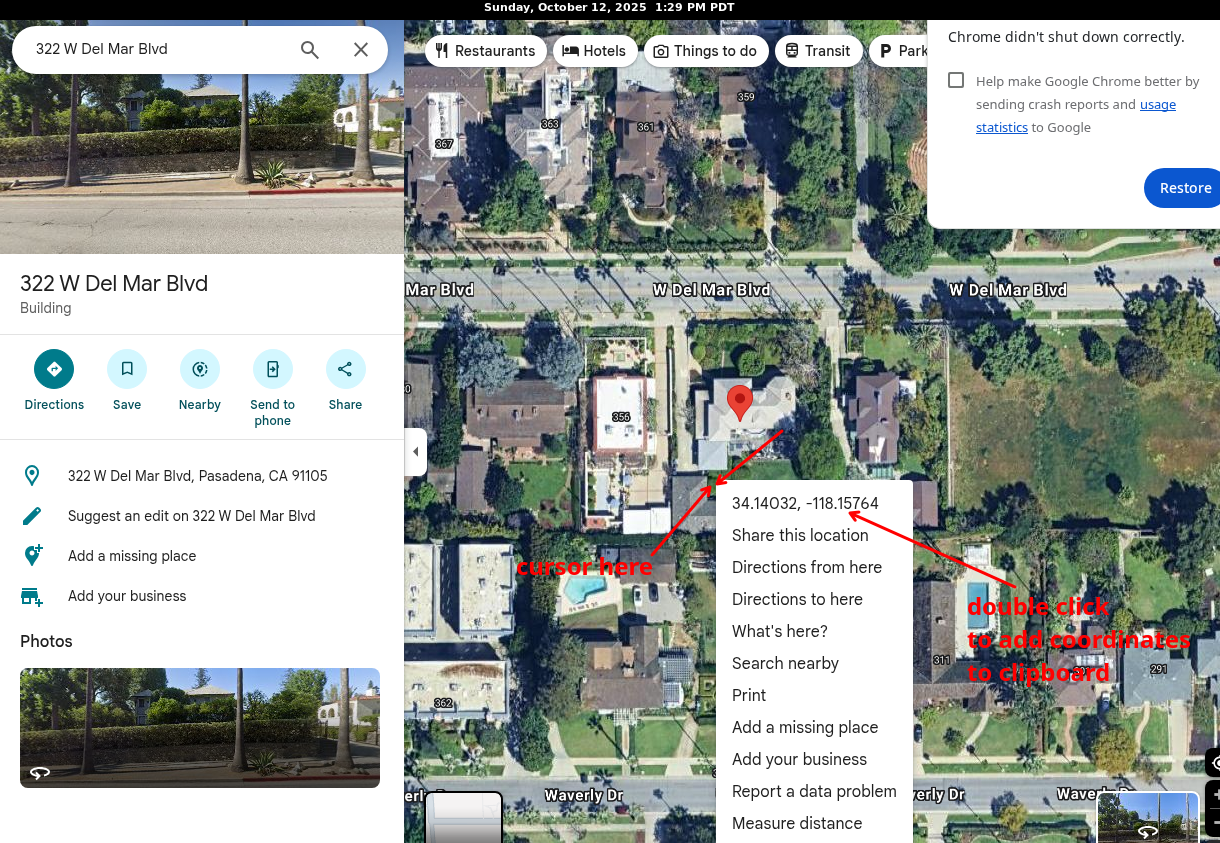
<td>Pasadena, CA</td>
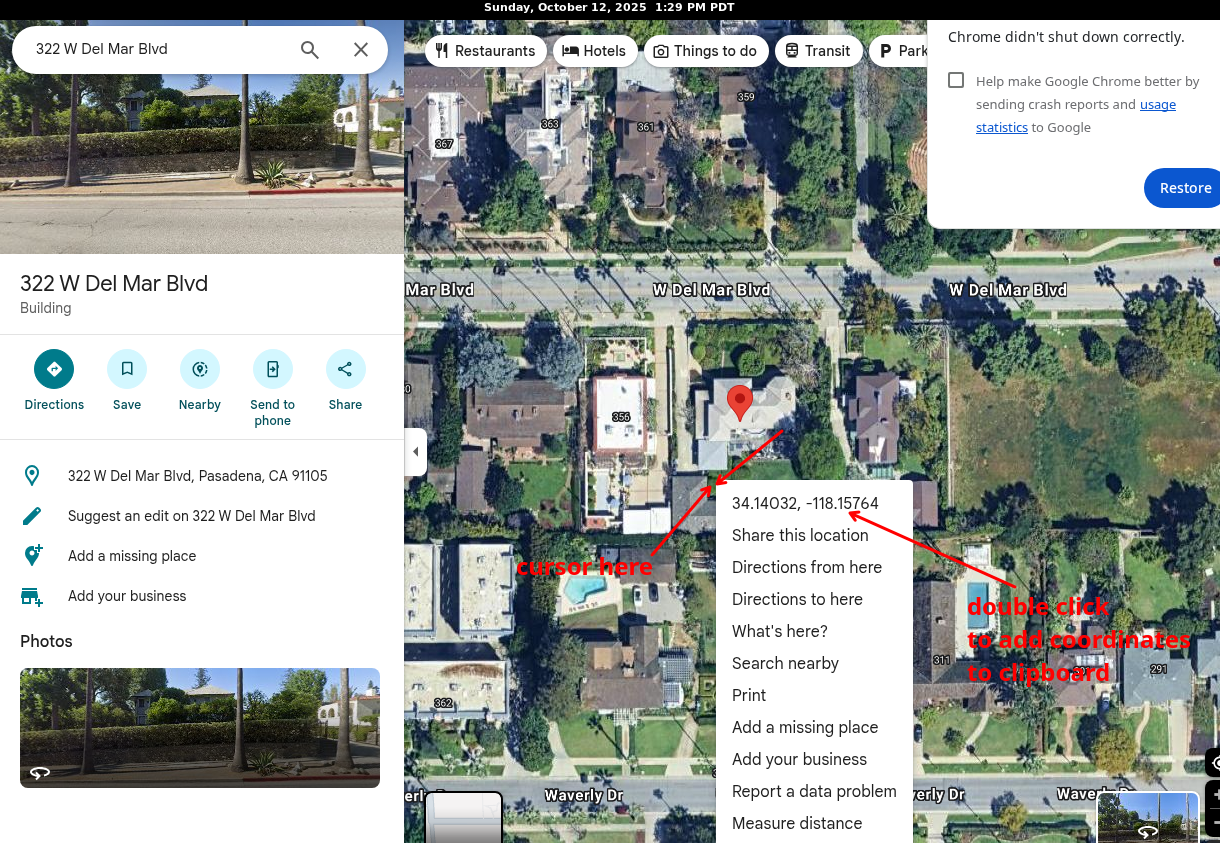
<td>A residence at 322 W. Del Mar where I lived in when growing orchids in the 1980s, it is nearby where I grew up in the 1960s when I raised orchids. (Thank you, John Hugens for inspiring me in the 1960s.)</td>
<td><img class="wp-image-316" src="https://salemdata.net/johnpress/wp-content/uploads/2025/10/20251012_132804_Sun-1.png" alt="" /></td>
</tr>
<tr>
<td>Napa, CA</td>
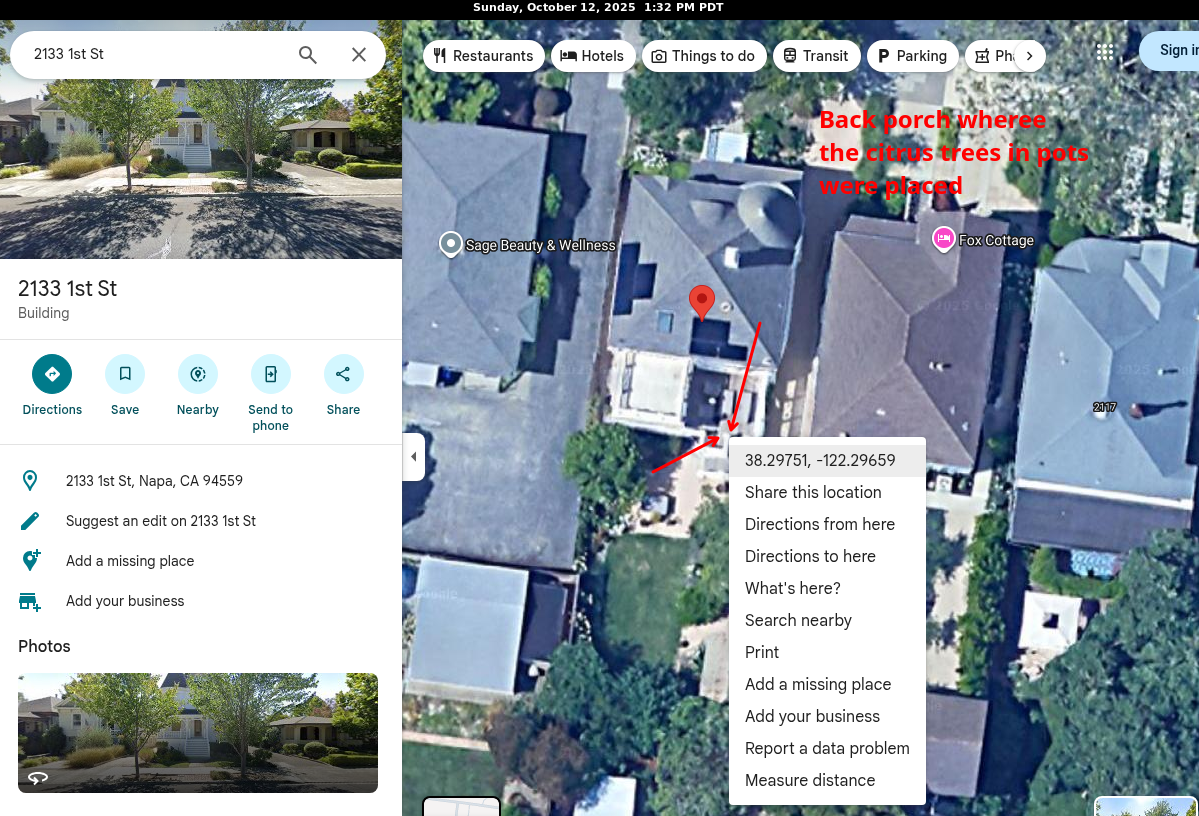
<td>Grew citrus in clay pots on a porch with great sun exposure from 2008 to 2017</td>
<td><img class="wp-image-316" src="https://salemdata.net/johnpress/wp-content/uploads/2025/10/20251012_133203_Sun.png" alt="" /></td>
</tr>
<tr>
<td>Salem, OR</td>
<td>Current residence where I have built a greenhouse</td>
<td> </td>
</tr>
<tr>
<td>Volcano, HI</td>
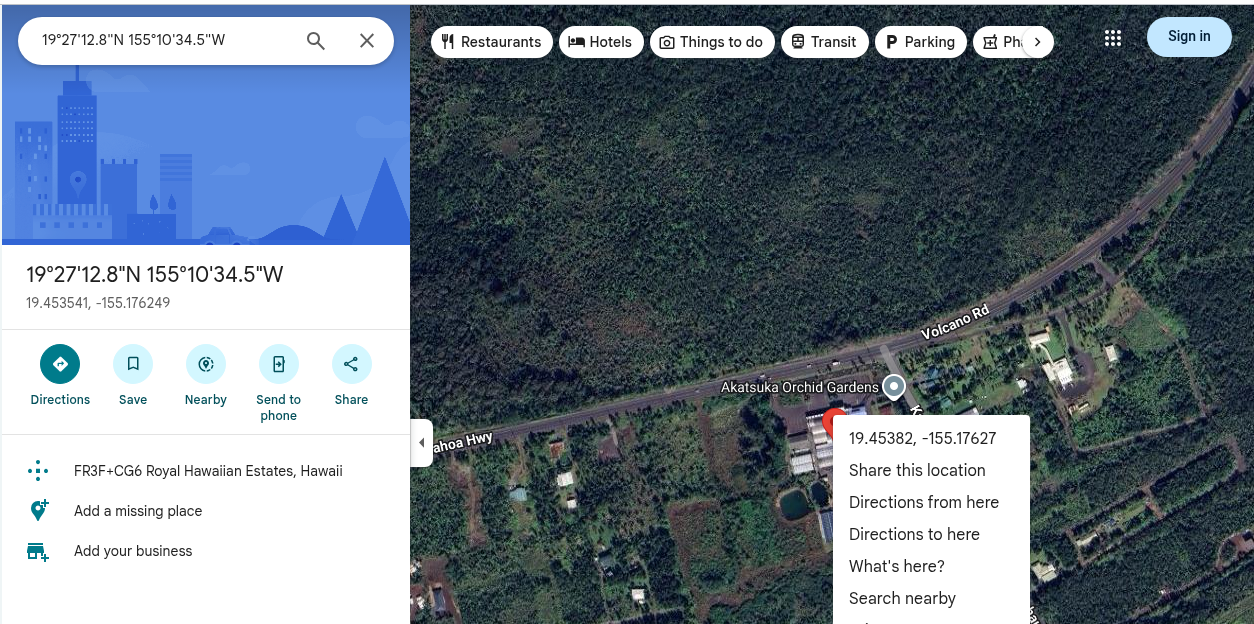
<td>Akatsuka Orchids on the island of Hawaii</td>
<td><img class="wp-image-322" src="https://salemdata.net/johnpress/wp-content/uploads/2025/10/20251012_162827_Sun.png" alt="" /></td>
</tr>
<tr>
<td>Villa Park, IL</td>
<td>Orchids by Hausermann</td>
<td><img class="wp-image-314" src="https://salemdata.net/johnpress/wp-content/uploads/2025/10/20251012_132804_Sun.png" alt="" /></td>
</tr>
<tr>
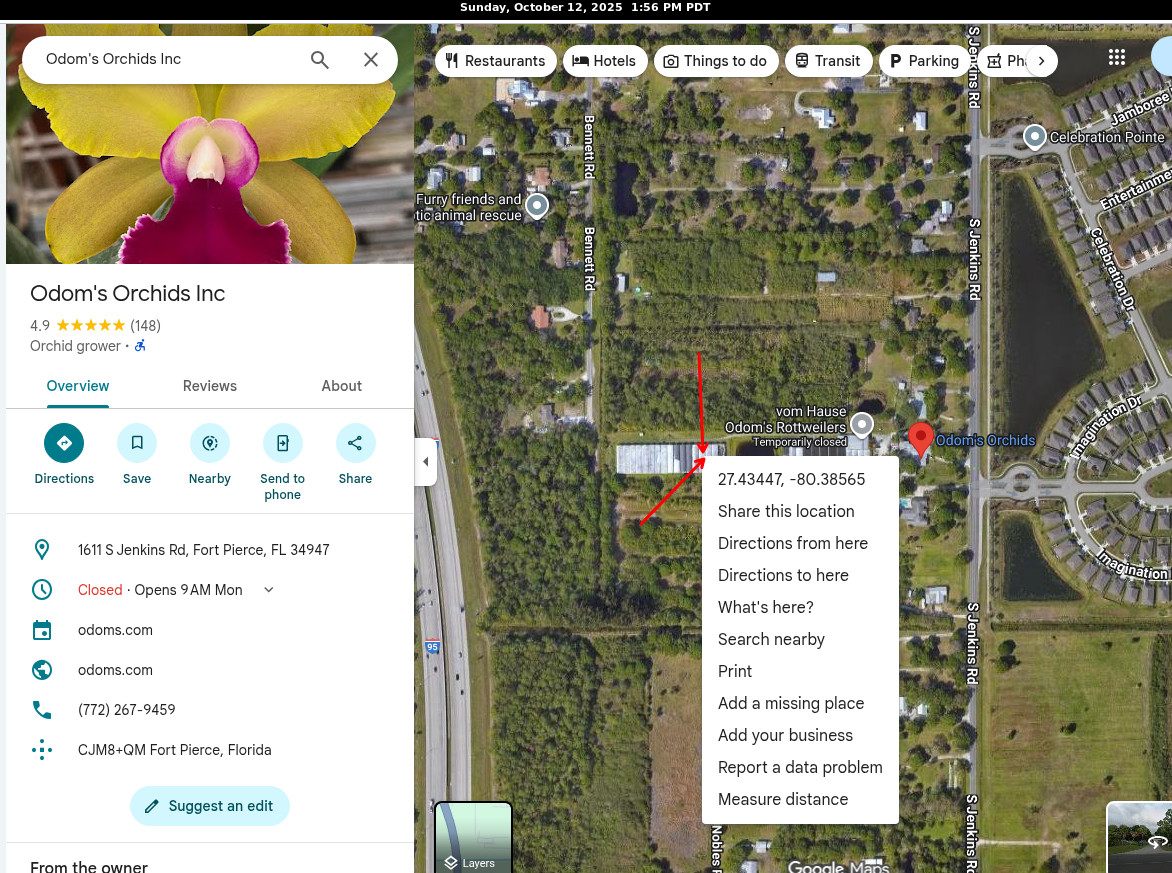
<td>Fort Pierce, FL</td>
<td>Odom’s Orchids</td>
<td><img class="wp-image-315" src="https://salemdata.net/johnpress/wp-content/uploads/2025/10/20251012_135544_Sun.png" alt="" /></td>
</tr>
</tbody>
</table>
</figure>
<p class="wp-block-paragraph">With ChatGPT, I designed and built a set of scripts which collect sun radiation data from NASA for a given latitude and longitude from a specified date range. These NASA-derived values describe the available outdoor solar resource at each location. They do not account for greenhouse glazing, shade cloth, nearby structures, or other local obstructions.</p>
<p class="wp-block-paragraph">First the user uses Google Maps to locate the precise location, e.g. a particular greenhouse, to obtain its latitude and longitude.</p>
<p class="wp-block-paragraph">The user then fills out a text file which acts as a manifest providing a name and the coordinates. Then the user runs the first script which reads that manifest and downloads the data and creates a spreadsheet of all the locations. The second script reads the same manifest, locates the spreadsheet files, and then creates two charts combining all the locations; you can toggle any of the locations ON/OFF to quickly visualize a comparison.</p>
<p class="wp-block-paragraph">It appears NASA is about 45 days from finalizing its data sets, so on October 12, 2025, I selected a time period of 12 years starting with January 1, 2013, and ending with June 30, 2025.</p>
<ol class="wp-block-list">
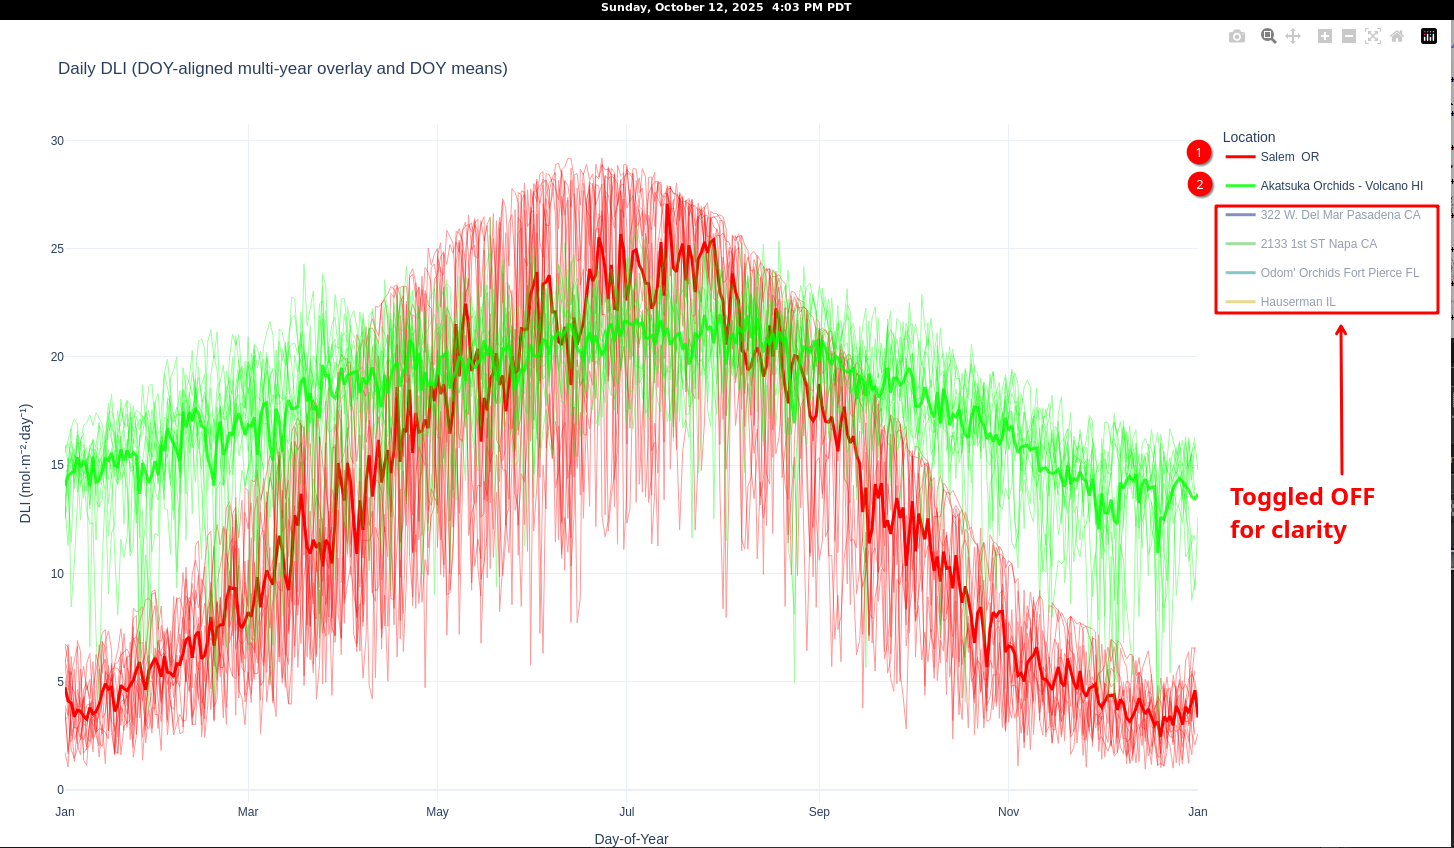
<li>A Daily Light Integral (“DLI”) DLI describes the number of photosynthetically active photons (individual particles of light in the 400-700 nm range) that are received in one square meter during a day. This variable is particularly useful to describe the light environment of plants. Think of DLI as an equivalent to a rain gauge statistic that measures rainfall, e.g. 2.4 inches, over 24 hours. <strong>Rainfall (inches)</strong> measures <strong>the accumulated amount of water</strong> that fell during a day. <strong>DLI (mol·m⁻²·day⁻¹)</strong> measures <strong>the accumulated amount of photosynthetically active photons</strong> that struck a square meter over a day. Plants have a recommended amount of DLI, so this measurement system is used to determine if a plant is getting too much or too little sunlight.</li>
</ol>
<figure class="wp-block-image size-full is-resized wp-duotone-unset-3"><img class="wp-image-318" style="width: 458px; height: auto;" src="https://salemdata.net/johnpress/wp-content/uploads/2025/10/20251012_160220_Sun.png" alt="" /></figure>
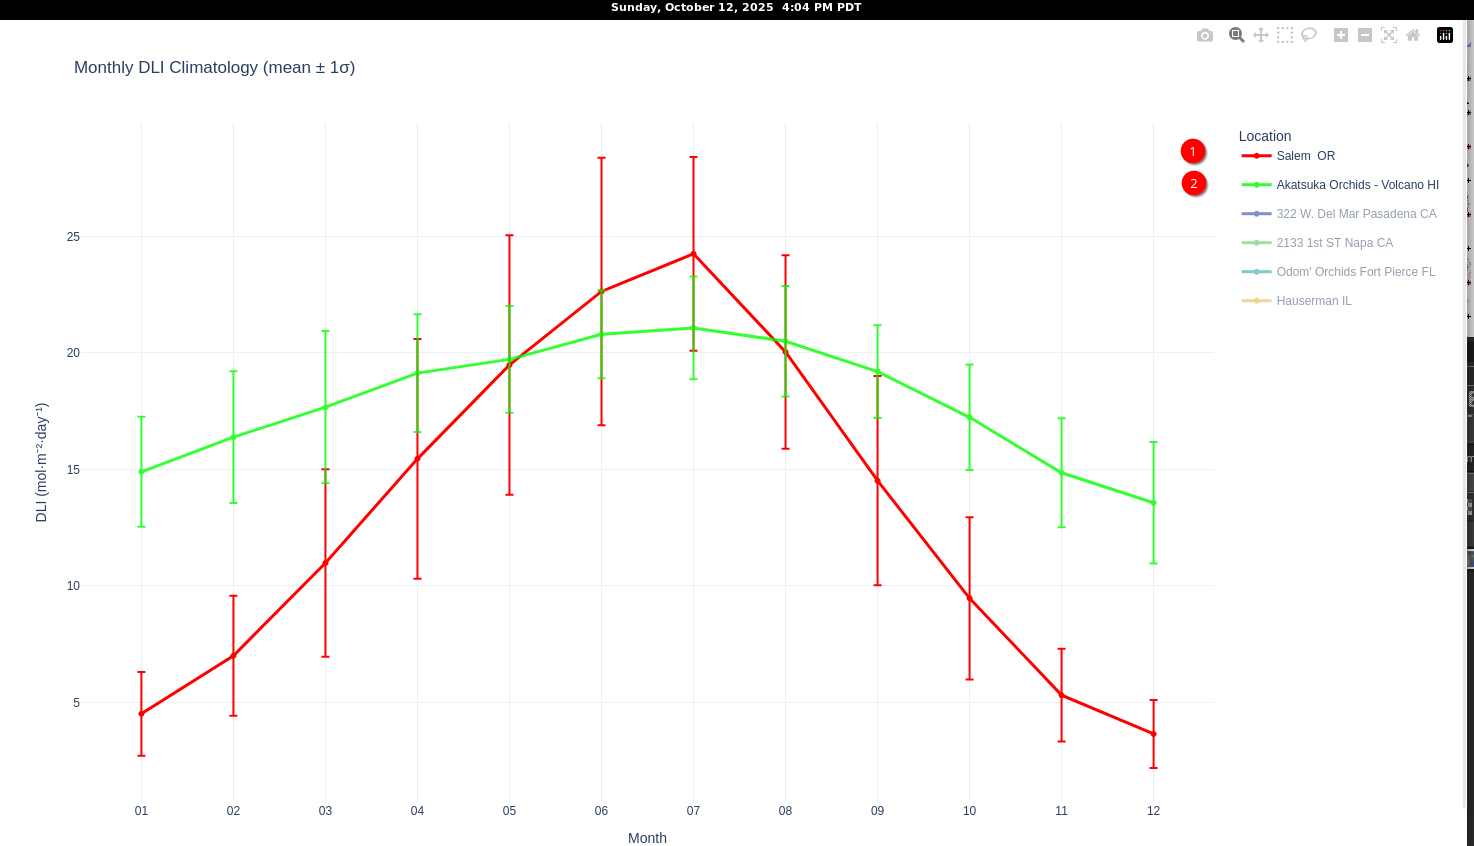
<p class="wp-block-paragraph">2. A Monthly DLI with means and standard deviations</p>
<figure class="wp-block-image size-full wp-duotone-unset-4"><img class="wp-image-319" src="https://salemdata.net/johnpress/wp-content/uploads/2025/10/20251012_160341_Sun.png" alt="" /></figure>
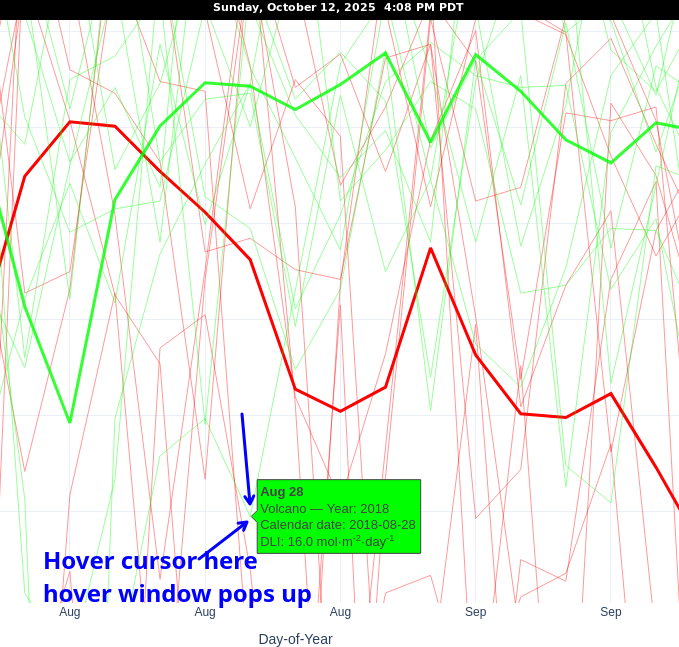
<p class="wp-block-paragraph">Salem briefly equals or exceeds the Hawaiian location during summer, but its winter DLI falls dramatically. Hawaii provides a much more uniform year-round light environment. Do not let these simple screenshots fool you. These graphs are chock-full of data and the 6 different data sets can be toggled ON or OFF. Moreover, you can zoom in anywhere on the graphs and see much greater detail. Example:</p>
<figure class="wp-block-image size-full wp-duotone-unset-5"><img class="wp-image-320" src="https://salemdata.net/johnpress/wp-content/uploads/2025/10/20251012_160751_Sun.png" alt="" /></figure>
<p class="wp-block-paragraph"> </p>
<h2 class="wp-block-heading">Details</h2>
<p class="wp-block-paragraph">To explore the graphs and dive into the details:</p>
<p class="wp-block-paragraph"><strong>Charts</strong></p>
<p class="wp-block-paragraph"><a href="https://salemdata.net/plots/dli_climatology_20251012_1400.html">https://salemdata.net/plots/dli_climatology_20251012_1400.html</a></p>
<p class="wp-block-paragraph"><a href="https://salemdata.net/plots/dli_daily_multi_year_20251012_1400.html">https://salemdata.net/plots/dli_daily_multi_year_20251012_1400.html</a></p>
<p class="wp-block-paragraph"><strong>Spreadsheet</strong></p>
<p class="wp-block-paragraph"><a href="https://salemdata.net/plots/dli_climatology_summary_20251012_1400.csv">https://salemdata.net/plots/dli_climatology_summary_20251012_1400.csv</a></p>
<p class="wp-block-paragraph"><strong>Data</strong></p>
<p class="wp-block-paragraph"><a href="https://salemdata.net/plots/_20251012_1400_">https://salemdata.net/plots/<strong>_20251012_1400_</strong></a></p>
<h2 class="wp-block-heading">Looking Forward</h2>
<p class="wp-block-paragraph">I am considering using artificial LED lighting to supplement the winter months and/or possibly mimicking the sunlight of Akatsuka’s Orchids in Hawaii.</p>
<p class="wp-block-paragraph">With this data, I can compute the difference between Salem and a particular location and then dial in a light intensity setting to an artificial lighting system so that it can mimic the remote area. This would only apply for times when Salem is short on light intensity, such as in December through February.</p>
<h2>Conclusion</h2>
<p>This modeled comparison established the regional baseline. The next step was to measure the light actually reaching plants in my Salem greenhouse using an Apogee sensor and compare those observations with the historical NASA data.</p>
<h3>Acknowledgments</h3>
<p class="wp-block-paragraph">The data was obtained from National Aeronautics and Space Administration (<abbr title="National Aeronautics and Space Administration">NASA</abbr>) Langley Research Center’s Prediction Of Worldwide Energy Resources (<abbr title="Prediction Of Worldwide Energy Resources">POWER</abbr>) project funded through the <abbr title="National Aeronautics and Space Administration">NASA</abbr> Earth Science Division. <a href="https://power.larc.nasa.gov/docs/"> https://power.larc.nasa.gov/docs/</a></p>
Growing orchids in Salem, OR, is not the same as growing in Pasadena, CA, where I started growing orchids in the 1960s. I had not given much thought about the difference in sunlight and now see that I should have. I specified my Salem greenhouse to have a 50% tinted polycarbonate roof thinking I could avoid shade cloth such as I used in Pasadena, but it turns out the tinted roofing is depriving my plants, especially citrus, of the much needed sunlight during the winter. I’m replacing the tinted roof panels with clear which will change the light transmission from 50% to 80%. I’ll then use a light shade cloth during the more intense summer months.
I therefore embarked on a study to compare sunlight both with the three places I have lived: Pasadena, CA, Napa, CA, and presently Salem, OR. I also decided I wanted to see how those locations compared to three orchid merchants located in Hawaii, Florida, and Illinois. Therefore, a sunlight radiance study is in order.
Six Orchid/Citrus Locations Of Interest
The six locations of interest are:
Location
Description
Google Maps ScreenshotShowing Coordinates
Pasadena, CA
A residence at 322 W. Del Mar where I lived in when growing orchids in the 1980s, it is nearby where I grew up in the 1960s when I raised orchids. (Thank you, John Hugens for inspiring me in the 1960s.)
Napa, CA
Grew citrus in clay pots on a porch with great sun exposure from 2008 to 2017
Salem, OR
Current residence where I have built a greenhouse
Volcano, HI
Akatsuka Orchids on the island of Hawaii
Villa Park, IL
Orchids by Hausermann
Fort Pierce, FL
Odom’s Orchids
With ChatGPT, I designed and built a set of scripts which collect sun radiation data from NASA for a given latitude and longitude from a specified date range. These NASA-derived values describe the available outdoor solar resource at each location. They do not account for greenhouse glazing, shade cloth, nearby structures, or other local obstructions.
First the user uses Google Maps to locate the precise location, e.g. a particular greenhouse, to obtain its latitude and longitude.
The user then fills out a text file which acts as a manifest providing a name and the coordinates. Then the user runs the first script which reads that manifest and downloads the data and creates a spreadsheet of all the locations. The second script reads the same manifest, locates the spreadsheet files, and then creates two charts combining all the locations; you can toggle any of the locations ON/OFF to quickly visualize a comparison.
It appears NASA is about 45 days from finalizing its data sets, so on October 12, 2025, I selected a time period of 12 years starting with January 1, 2013, and ending with June 30, 2025.
A Daily Light Integral (“DLI”) DLI describes the number of photosynthetically active photons (individual particles of light in the 400-700 nm range) that are received in one square meter during a day. This variable is particularly useful to describe the light environment of plants. Think of DLI as an equivalent to a rain gauge statistic that measures rainfall, e.g. 2.4 inches, over 24 hours. Rainfall (inches) measures the accumulated amount of water that fell during a day. DLI (mol·m⁻²·day⁻¹) measures the accumulated amount of photosynthetically active photons that struck a square meter over a day. Plants have a recommended amount of DLI, so this measurement system is used to determine if a plant is getting too much or too little sunlight.
2. A Monthly DLI with means and standard deviations
Salem briefly equals or exceeds the Hawaiian location during summer, but its winter DLI falls dramatically. Hawaii provides a much more uniform year-round light environment. Do not let these simple screenshots fool you. These graphs are chock-full of data and the 6 different data sets can be toggled ON or OFF. Moreover, you can zoom in anywhere on the graphs and see much greater detail. Example:
I am considering using artificial LED lighting to supplement the winter months and/or possibly mimicking the sunlight of Akatsuka’s Orchids in Hawaii.
With this data, I can compute the difference between Salem and a particular location and then dial in a light intensity setting to an artificial lighting system so that it can mimic the remote area. This would only apply for times when Salem is short on light intensity, such as in December through February.
Conclusion
This modeled comparison established the regional baseline. The next step was to measure the light actually reaching plants in my Salem greenhouse using an Apogee sensor and compare those observations with the historical NASA data.
Acknowledgments
The data was obtained from National Aeronautics and Space Administration (NASA) Langley Research Center’s Prediction Of Worldwide Energy Resources (POWER) project funded through the NASA Earth Science Division. https://power.larc.nasa.gov/docs/
Leave a Reply