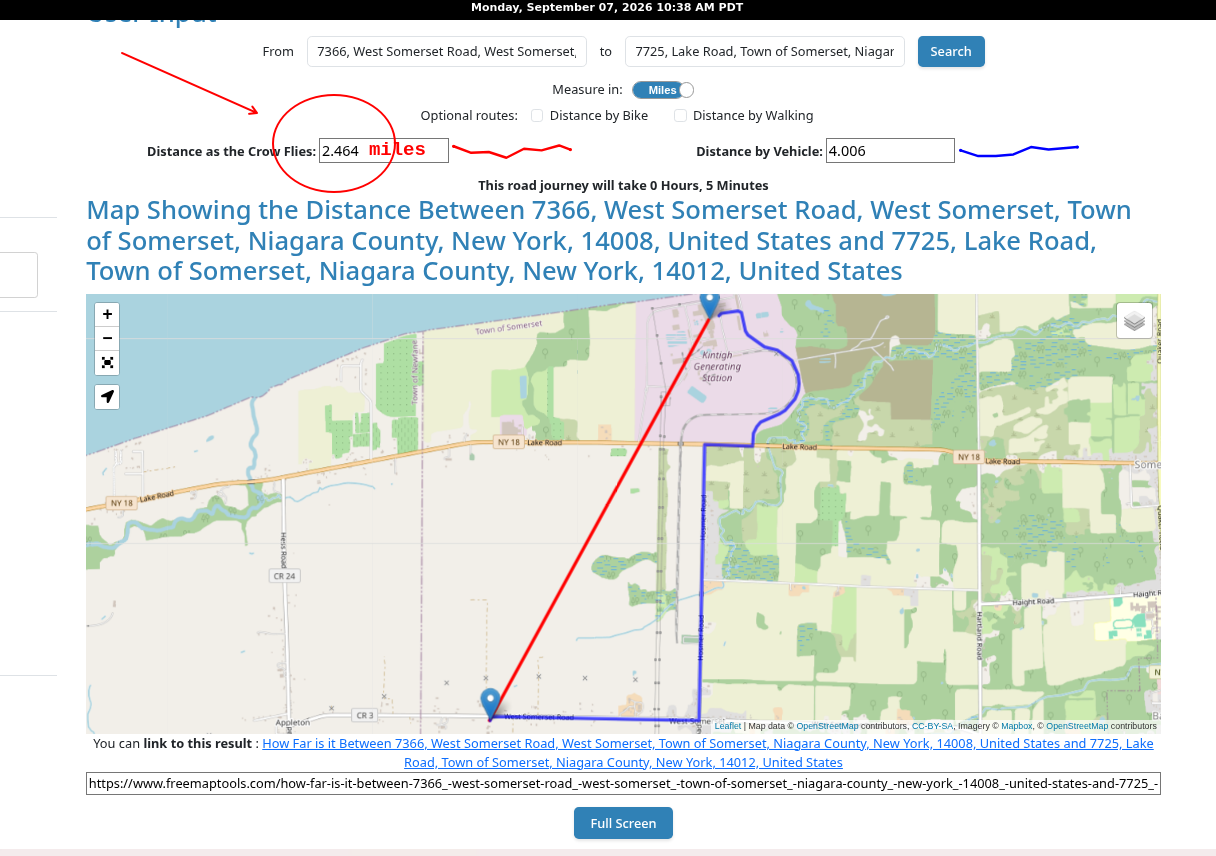
A recent article, “[t]he complex corporate web behind a \$3.2 billion AI data center When multiple companies are behind one project, who bears responsibility for problems?” published by Ars Technica at link, intrigued me. There was a reference to a resident living in a house built in 1892 who complained of the constant noise from the new data center. Her complaint followed a previous complaint, so the sound was causing her to file a 2nd complaint I determined where the complainant lived and where the data center was and concluded she lived 2.464 miles as the crow flies.
Somerset, New York: Lake Mariner Data Center Noise Map
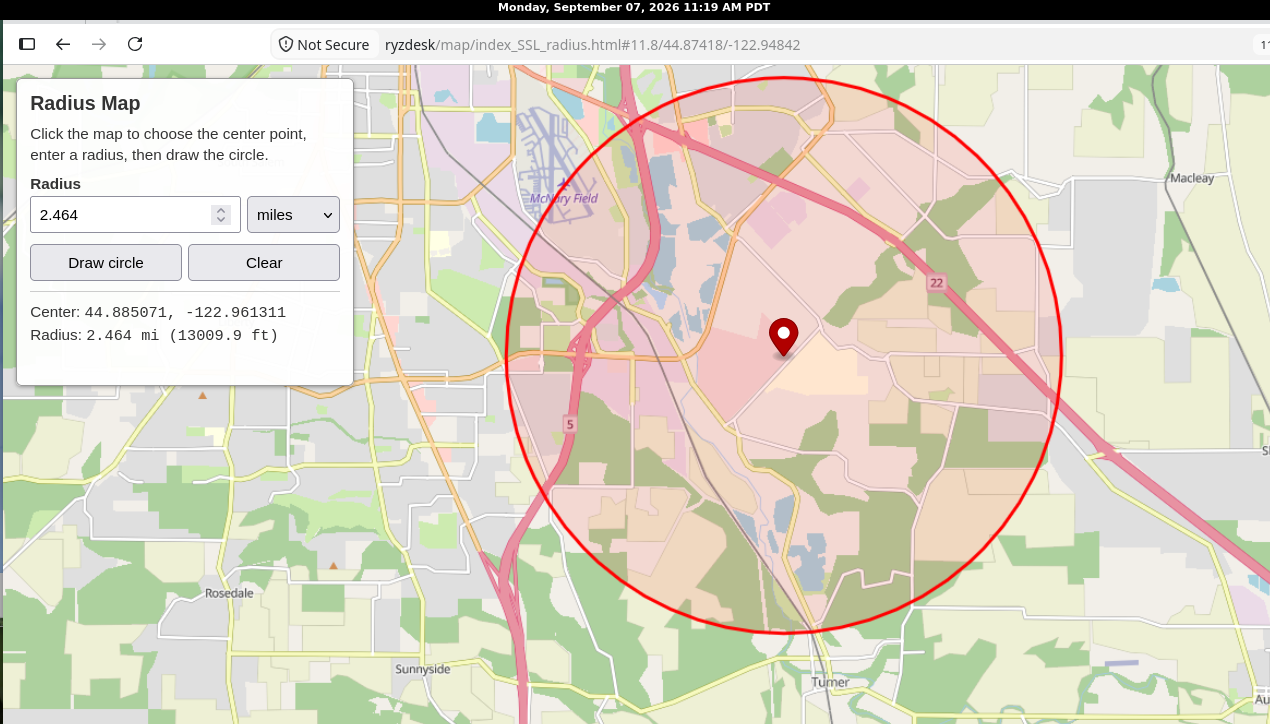
That concerned me. She wasn’t living 300 feet across a street. And the data center was only \$3.2 billion, whereas the proposed Google/Verrus project is \$5.1 billion. So I created a map for Salem, OR, where one can draw a red circle of a specified radius and locate the center point to see what neighborhoods lie within a 2.464 circle.
OK, so there are all kinds of variables here: topology, what sounds were reaching this lady’s home, are there generators at the data site possibly creating the sounds? It’s very clear there is little factual information. I was a litigator. I like facts.
In my aircraft sound monitoring project where I record the decibels aircraft generate over our property caused me to purchase a Reed Instruments R8080 decibel recorder, it is rated Class II for accuracy, meaning it might be 1-2 decibels off of a Class I — the highest rated recorder deemed acceptable by the Federal Aviation Administration, aka “FAA”. I use the R8080 to verify that the decibel chip, an I2C Decibel Sound Level Meter Module, I am using for logging the decibels every second (and every 200 milliseconds when the decibels exceed 65). Being 1-2 decibels off of what may be a theoretical decibel is close enough. So I asked ChatGPT about how I could use the R8080 to measure sounds emanating from existing data centers in nearby Hillsboro, OR. Hillsboro has 18 data centers. That’s when I learned that my R8080 only measures down to 20 Hz1. The range of frequencies below 20 Hz is referred to as Low frequency infrasound waves.
Frequencies capable of being heard by humans are called audio or audiblefrequencies, the range of which is typically considered to be between 20Hz and 20,000Hz.2
My feeling is: if I am going to go to the trouble of measuring something, then let’s measure the entire enchilada. I’ve been reading that there are lawsuits about data centers and their infrasound wave emissions. My wife told me she was trying to locate a National Institutes of Health, aka “NIH”, article about Low frequency infrasound waves and their effects on the human body and she determined the page removed. I was able to locate a copy of what I think she was searching for: “Health effects from low-frequency noise and infrasound in the general population: is it time to listen? A systematic review of observational studies.”3
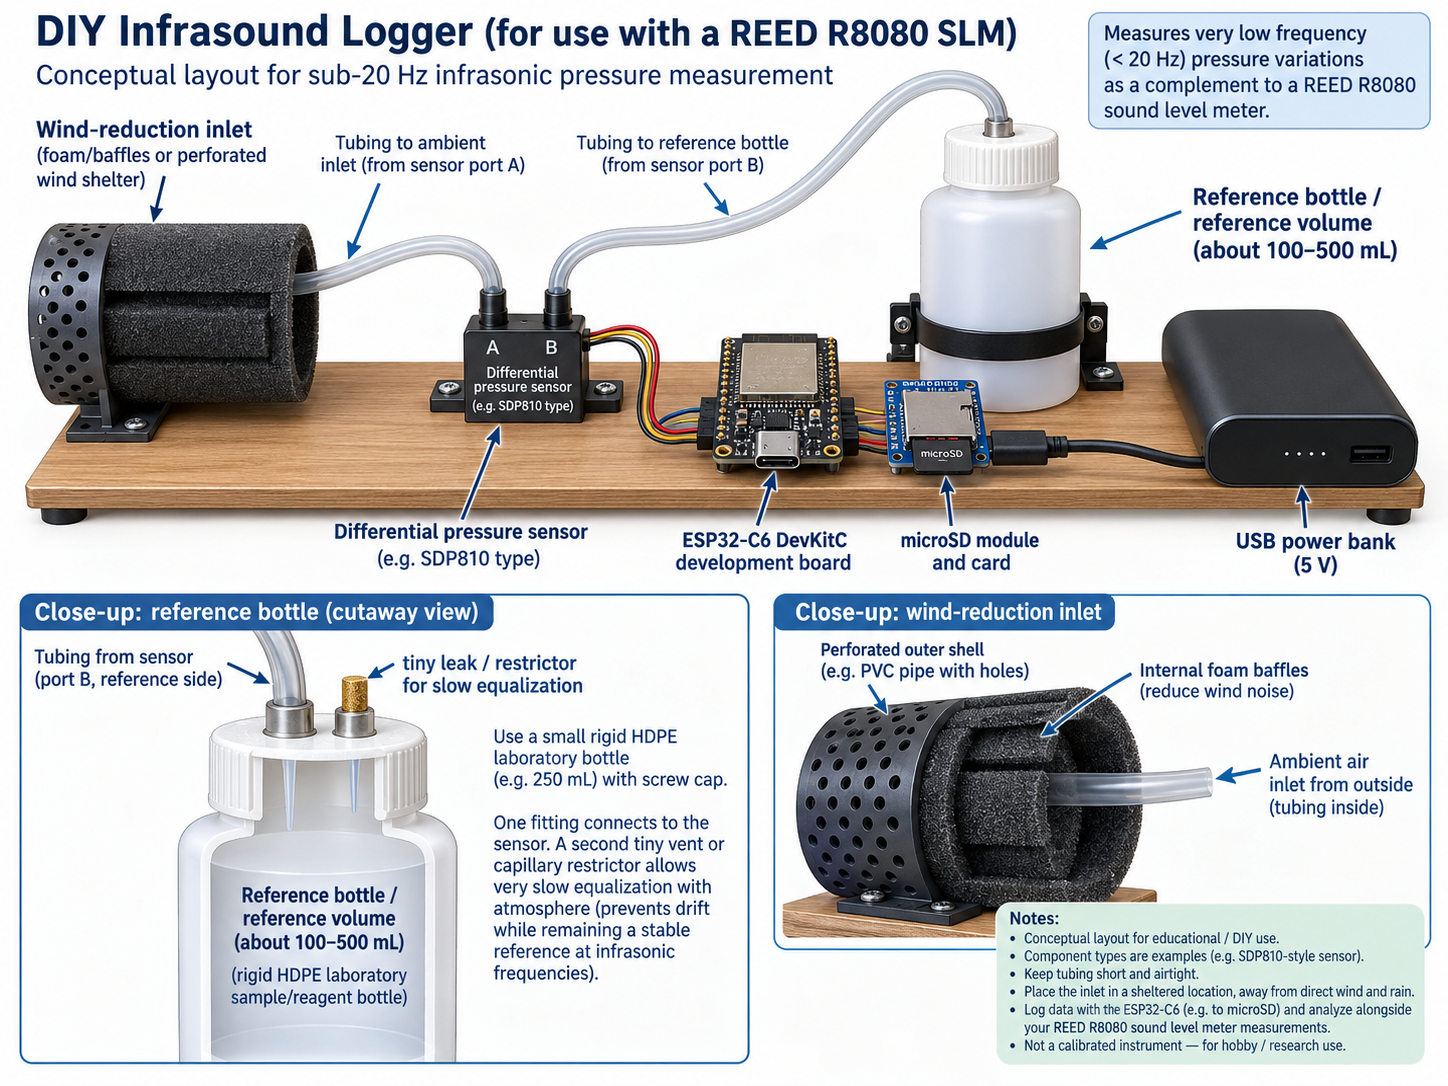
I then asked ChatGPT what could I do from a do-it-yourself approach to cover the shortfall of the R8080? I’m certain that purchases such a device probably runs well over \$1,000. It came back with a credible plan to build a measuring device for less than \$100. The heart of the device is the \$40 Sensiron SDP810-125Pa which is a differential pressure sensor.
A DIY Low Frequency Meausing Device Created by ChatGPT
The above visualization looks feasible, though I have concern about the wind-reduction component. Note: the pressure sensor plus bottle/baffle assembly depicted above is not yet a calibrated infrasound instrument, it’s just a visualization of a concept experiment. At what point do the foam baffles curtail the sound your trying to measure vs. the wind? That opened another can of worms? How do I know the wind baffle is capturing the sounds in the range I might hope to track, e.g. 1 Hz – 20 Hz? Well, that lead into a design discussion of an infrasound generator, i.e. a low-frequency pressure source — again, something that looks feasible.
I asked ChatGPT to provide me a sample set of data that might be accumulate and just how would that be transformed into something meaningful. It obliged responded:
Yes. For a first version, I would store raw time-series samples, not just processed “dB” values.
If the ESP32 samples at 100 Hz, each row represents 0.01 second. A practical CSV might look like this:
timestamp sample_no pressure_pa temp_c status
20260908_113200.000 0 0.012 21.84 OK
20260908_113200.010 1 0.018 21.84 OK
20260908_113200.020 2 0.026 21.84 OK
20260908_113200.030 3 0.031 21.84 OK
20260908_113200.040 4 0.028 21.84 OK
20260908_113200.050 5 0.019 21.84 OK
20260908_113200.060 6 0.006 21.84 OK
20260908_113200.070 7 -0.009 21.84 OK
20260908_113200.080 8 -0.022 21.84 OK
20260908_113200.090 9 -0.030 21.84 OK
20260908_113200.100 10 -0.027 21.84 OK
20260908_113200.110 11 -0.017 21.84 OK
20260908_113200.120 12 -0.003 21.84 OK
20260908_113200.130 13 0.011 21.84 OK
20260908_113200.140 14 0.023 21.84 OK
20260908_113200.150 15 0.030 21.84 OK
The important column is pressure_pa. That is the instantaneous differential pressure measured by the sensor.
The values above are fabricated just to illustrate structure. They look vaguely sinusoidal because that makes the next step easier to visualize.
What those numbers mean
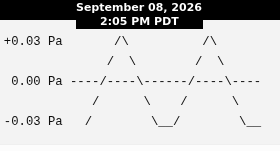
Suppose the pressure signal oscillates like this:
Graph of Pressure Readings
That repeated pressure variation is the raw physical phenomenon.
If it repeats, say, 10 times per second, that is a 10 Hz infrasonic component.
That discussion caused me to ask who else has been trying tackle the problem of measuring sounds from data centers, and ChatGPT pointed me towards the University of Colorado where there is a project entitled: Data Center Infrasound Research and Education Lab (DC-IRE Lab) and Preston Blackburn.
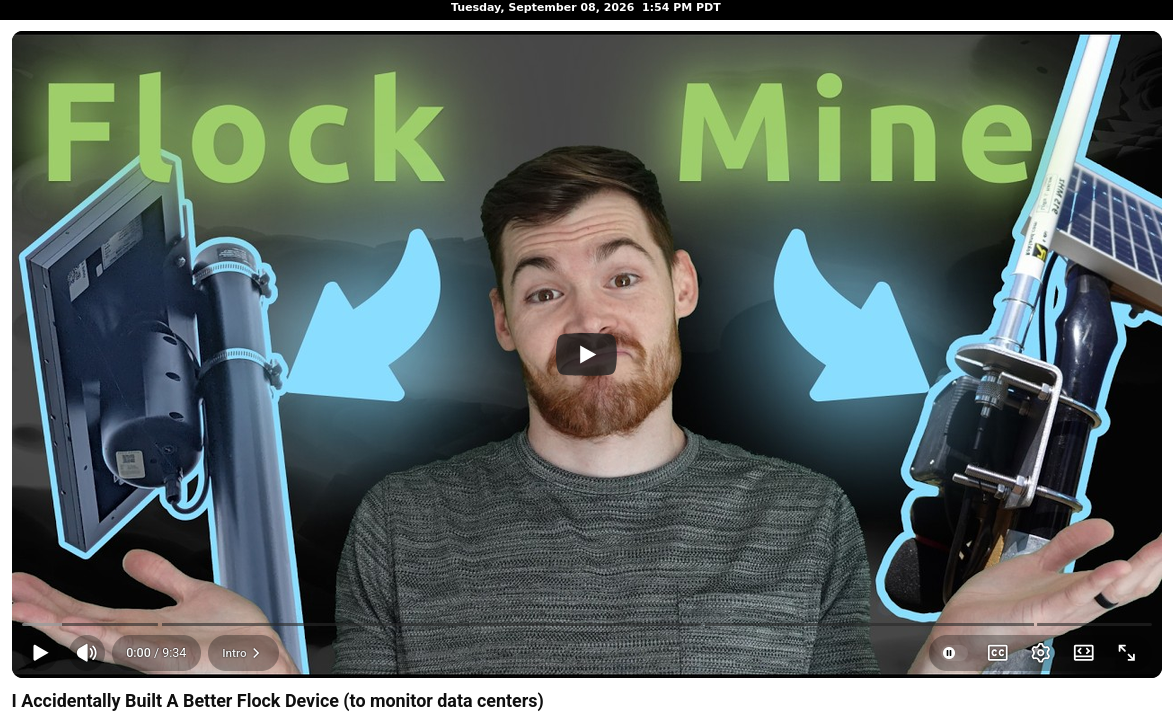
Here’s an intriguing link to a 10 minute video about the project narrated by Preston: https://www.youtube.com/watch?v=lsW-Isf31Mo
I especially like Preston’s irony of anti-Flock sentiment contrasted with anti-data center sentiment: both extremely popular causes these days.
20 Hz = 20 cycles per second. So 10 Hz is 10 cycles per second.
https://en.wikipedia.org/wiki/Perception#Sound.
Baliatsas, C., Kamp, I. van, Poll, R. van, Yzermans, J. Health effects from low-frequency noise and infrasound in the general population: is it time to listen? A systematic review of observational studies. Science of the Total Environment: 2016, 557, p. 163-169.
Leave a Reply